The Agricultural Commodity Repricing
A deep dive into the macro setup, structural supply and demand forces, fertilizer crisis, and six high-conviction equity ideas positioned for an agricultural upcycle. Built for traders working through the thesis themselves.
Executive Summary
The opening risk picture: oil shock, recession probability, and 1970s parallels.
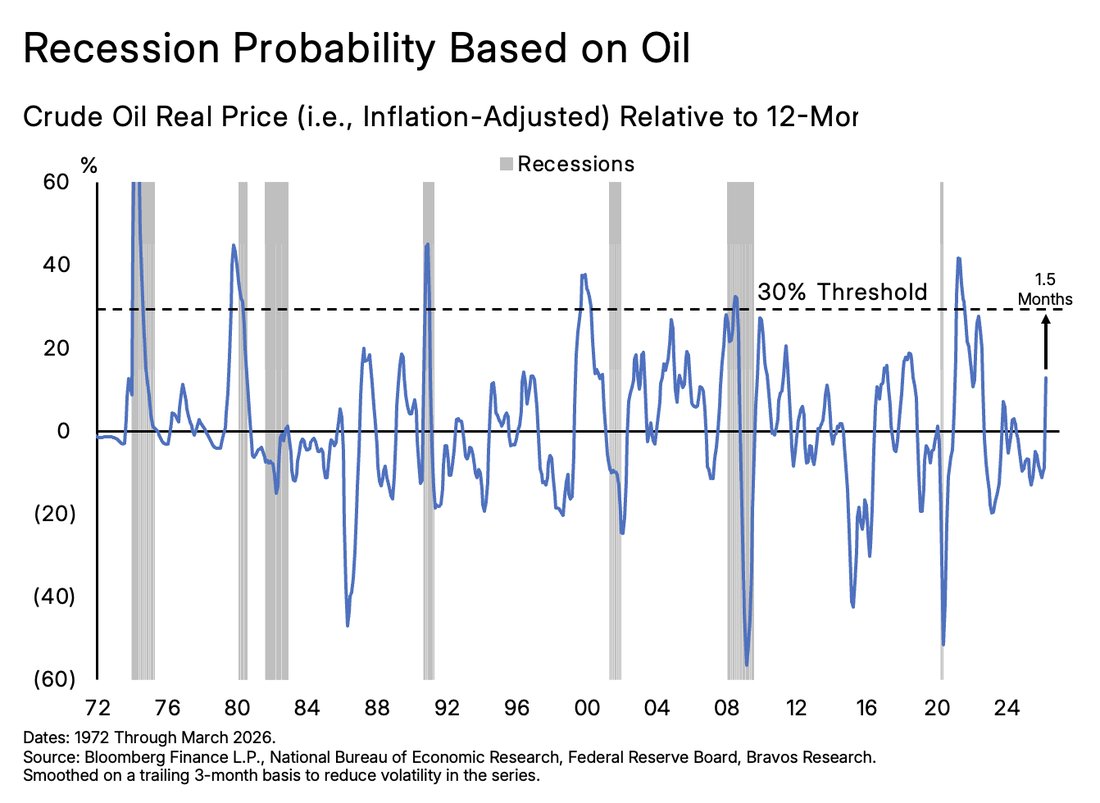
Significant Economic Risks Due to Higher Oil
Despite a potential ceasefire, oil has risen 50%+ since February 2026. Oil shocks hitting the +30% threshold for >3 months have typically preceded a recession. We will hit this threshold in 1.5 months.
In other words, if sustained, the jump in oil prices risks causing a hit to economic growth in 2026 putting broad equity market performance at risk in H2 of 2026. Oil coming down below $80 a barrel would make these risks come down.
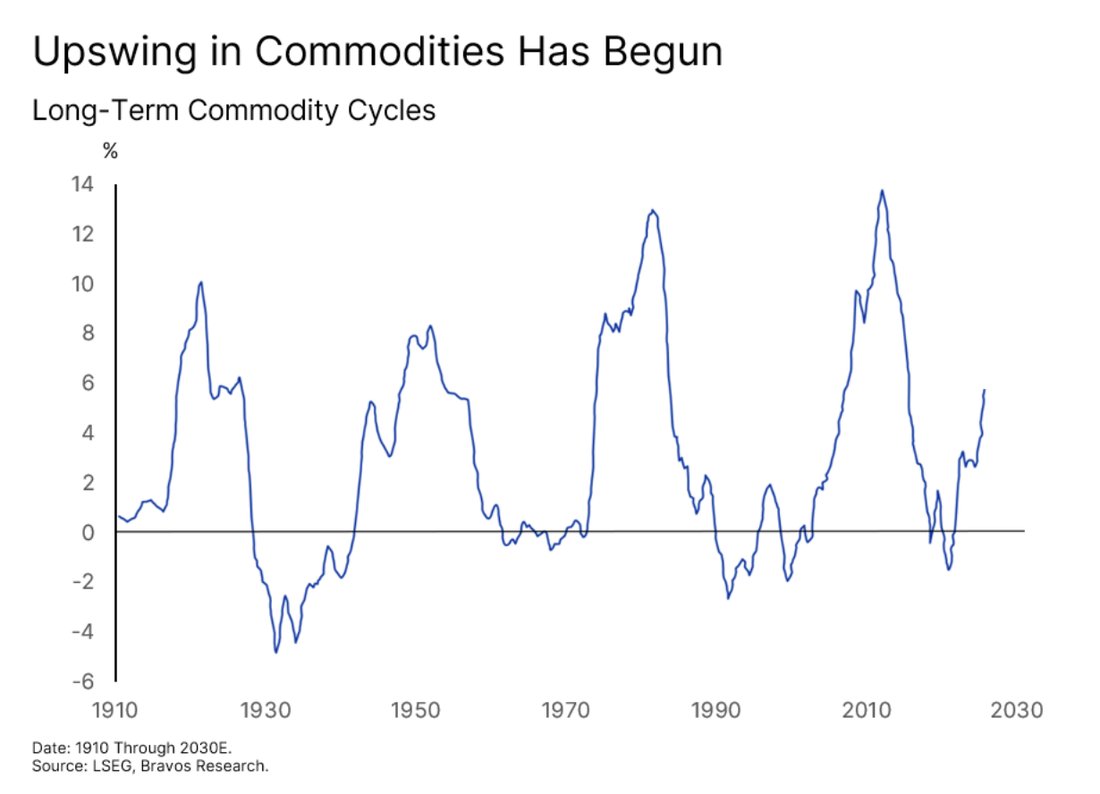
We’re in a Long-term Upswing in Commodity Markets
Regardless of the outcome of the war, we are experiencing the beginning of a long-term upswing in commodity prices driven by secular tailwinds of debasement and undersupply along with cyclical tailwinds from easy monetary and fiscal policies.
This could make it difficult for oil to come down and easy for it to move higher, which will put upward pressure on commodity prices across the board.
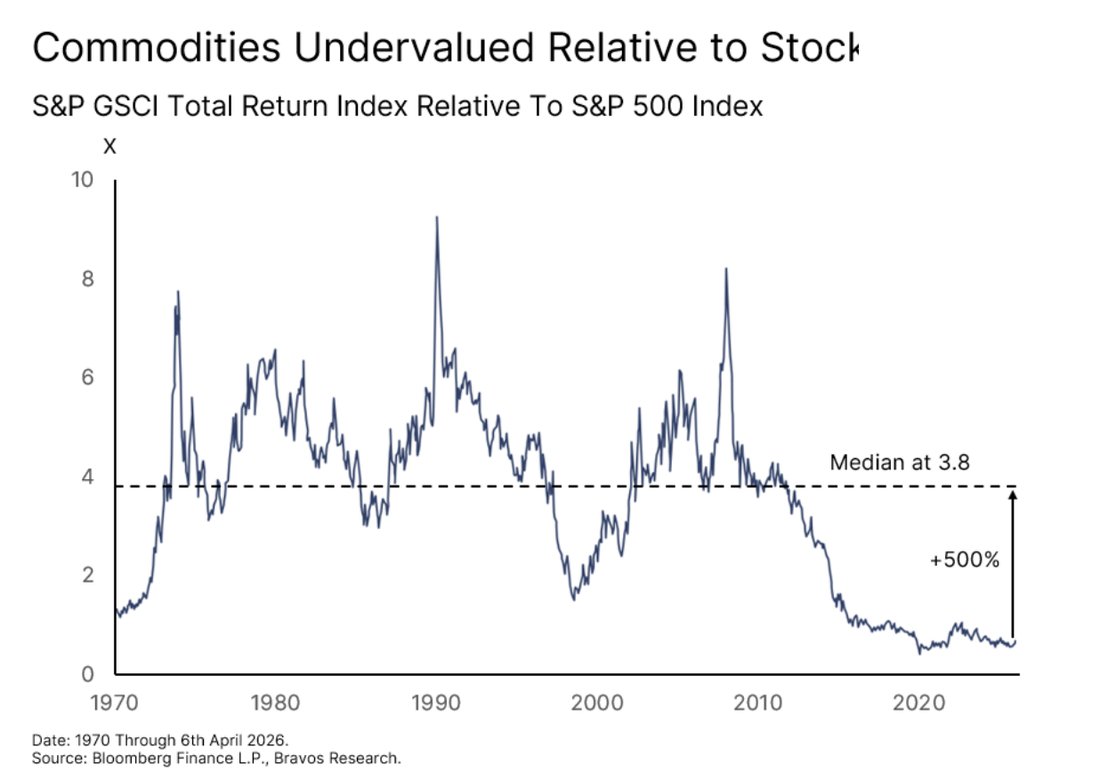
Substantial Runway for Commodities, Specifically Agricultural Commodities
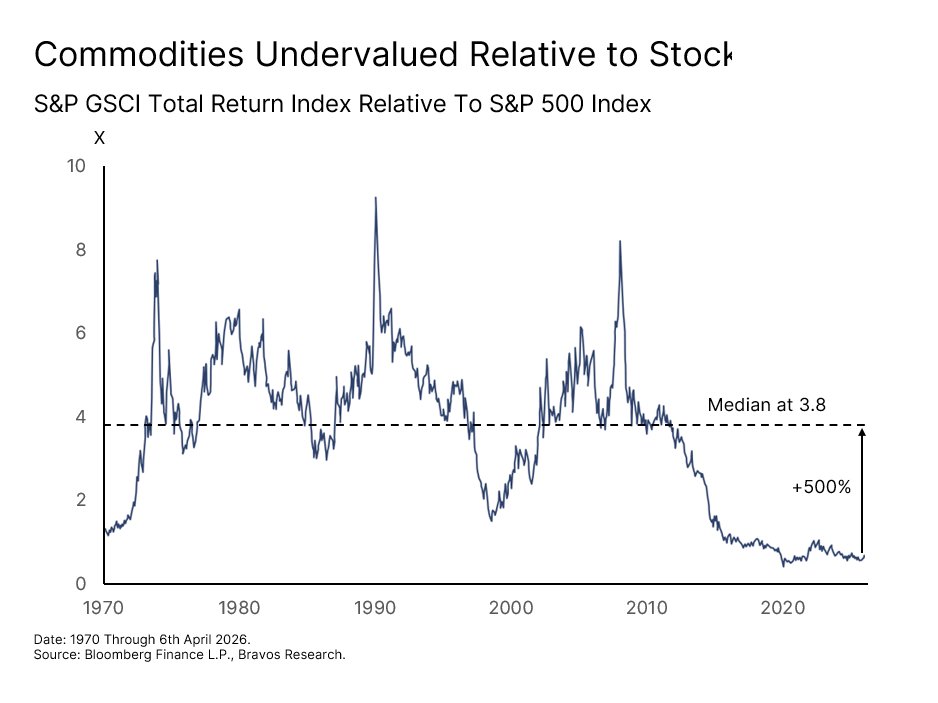
The performance of the commodities sector relative to the SP500 is near 100-year lows. A reversion to the 60-year median implies 500% outperformance of the commodity sector.
Agricultural commodities are particularly cheap right now when compared against Gold’s run up. This reflects very low concerns regarding the scarcity of these commodities and so plenty of room for markets to become more concerned. Wheat and corn for example could make new all time highs this cycle, implying >100% move on both.
Two ways to invest in the broad agricultural theme (without picking individual stocks): DBA where we have a 12 month target of $39 (+45%) and VEGI where we have a 12 month target of $81.50 (+80%).
Six Stock Picks
Snapshot of the six high-conviction names covered in this report.


Nutrien (NTR): The Cheapest Producer in an Inelastic Market

Nutrien is the world's largest fertilizer producer. It controls 20% of global potash supply and produces at a lower cost than its competitors, thanks to Canadian natural gas feedstock and world-class deposit grades. Fertilizer demand is highly inelastic, especially around the planting window. When crop prices rise the incentive to maximize yield further intensifies.
Fertilizer production is mostly a fixed-cost business, so incremental revenue flows directly to NTR’s bottom line. Every $25/tonne increase in nitrogen prices adds $250M to earnings. With urea up 50%+ since March 2026, that tailwind is building fast. NTR trades at 16x PE against a 10-year median of 25x, indicating the earnings expansion hasn’t been priced in yet.
The Andersons (ANDE): Best Play on Food Scarcity

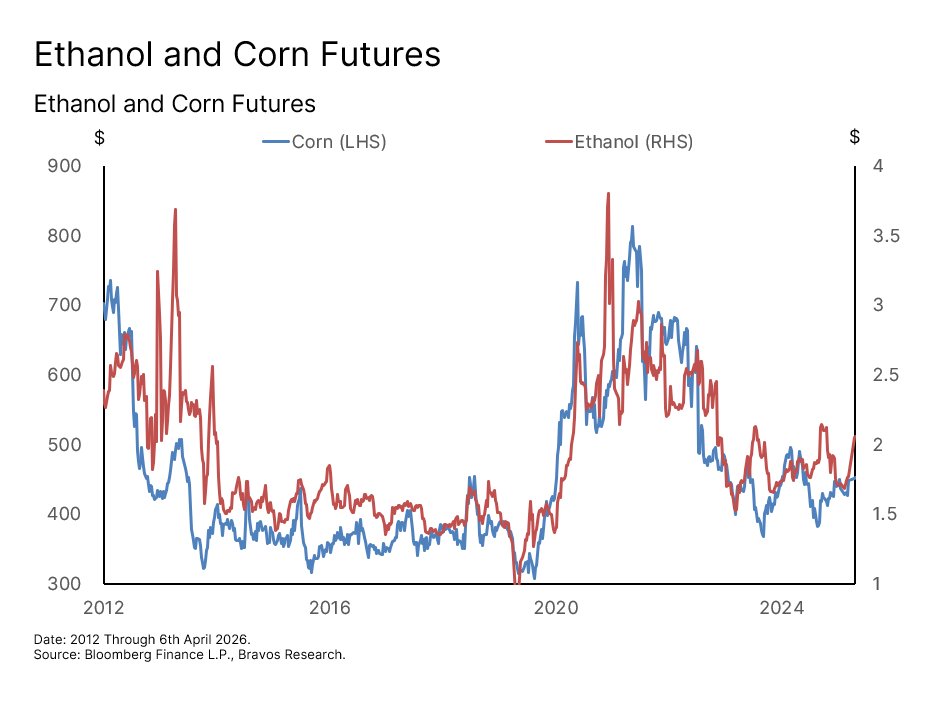
ANDE's core business model is commodity trading. They buy grains from farmers and sell them to exporters, ethanol plants, and food processors. ANDE has had a tough time with the cooling down of the agricultural market. A pick up in this market would lead to a revival of the company's revenues and earnings.
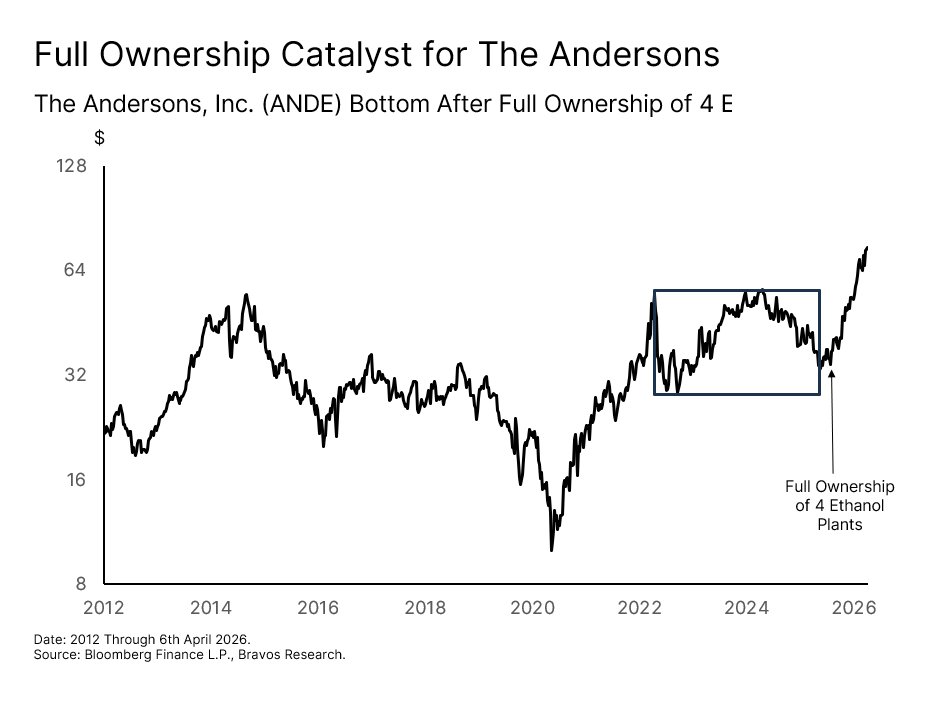
ANDE also recently acquired full ownership of multiple ethanol plants. This allows the company to use the grains it already buys from its core business model to produce ethanol at a large scale. This has the ability to significantly expand the profit margins of the company that have been historically quite narrow.
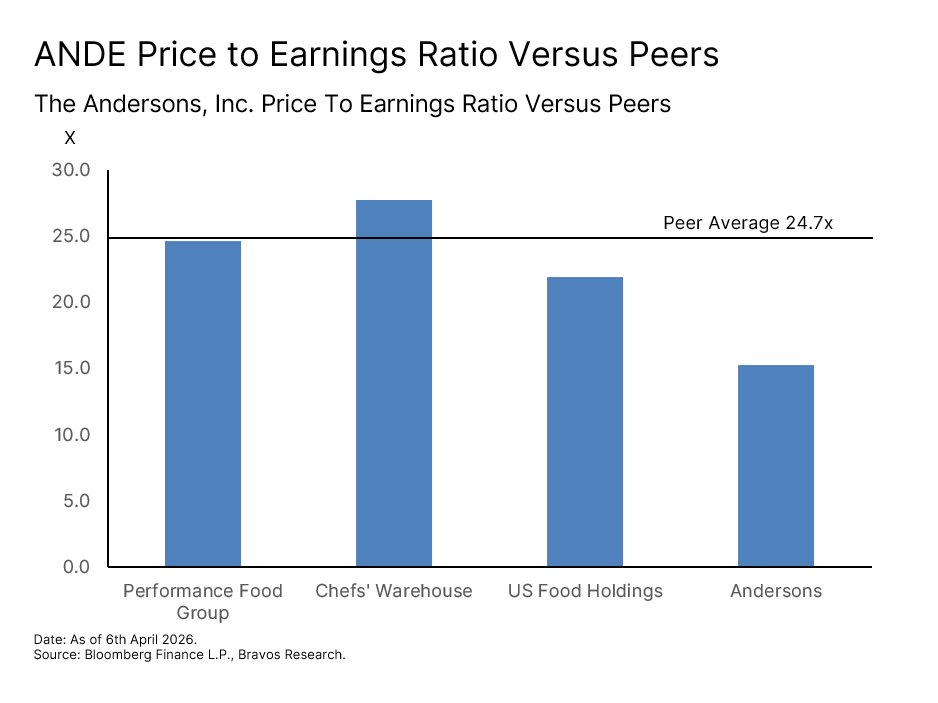
Together, these expansions have the potential to 2-3x ANDE's margins from a sub-1% base. At 15.3x forward PE against a peer average of 24.7x, the market is yet to catch up with the transformation underway.
Archer-Daniels-Midland (ADM): A High Beta Bet on Agricultural Prices

ADM is one of the world's largest agricultural processors, making it closely correlated to grain prices. The last few years were difficult for ADM, but the source of that difficulty is now becoming the primary catalyst for recovery.
Policy uncertainty around biofuel mandates froze soybean oil demand from renewable diesel producers. As a result, ADM's revenue fell by 20% and net margins compressed from 4.4% to 1.3%.
But the Trump administration recently finalized the mandates, requiring a 60% increase in biodiesel production and restoring the exact policy visibility that was missing. ADM also used the downturn to cut $200M in costs, meaning the recovery is flowing into a more efficient cost base than before.
As crop prices rise, ADM has substantial runway on both the earnings and valuation front.
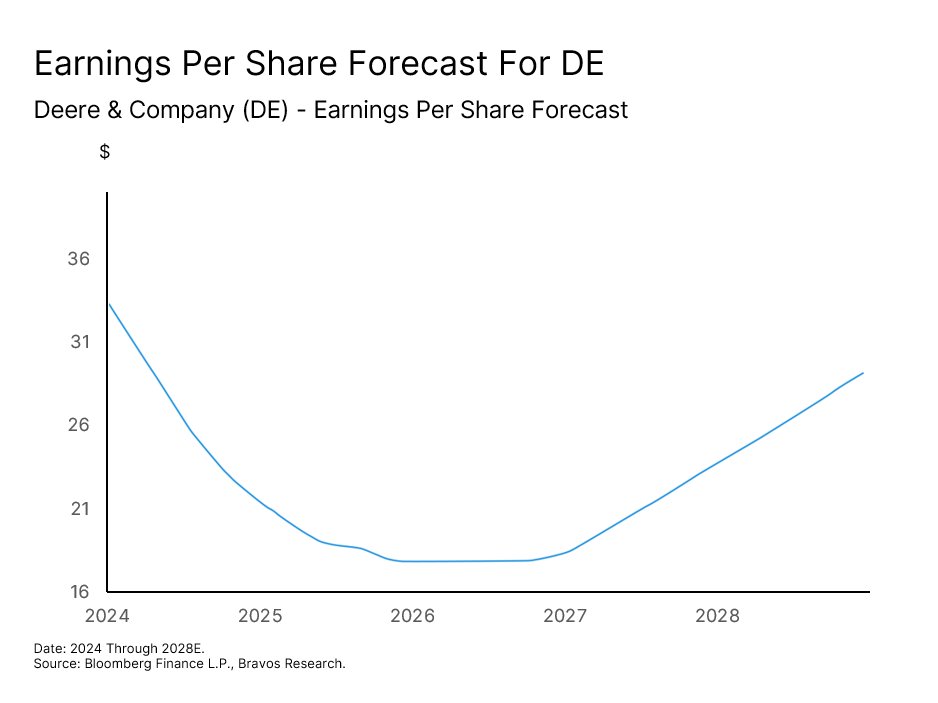
Deere & Company (DE): A Tech Bet in Agriculture
Rather than benefiting from the price of what farmers grow, Deere benefits from the economics of how they grow it. With fertilizer costs rising and labor getting scarce, efficiency matters more than ever.
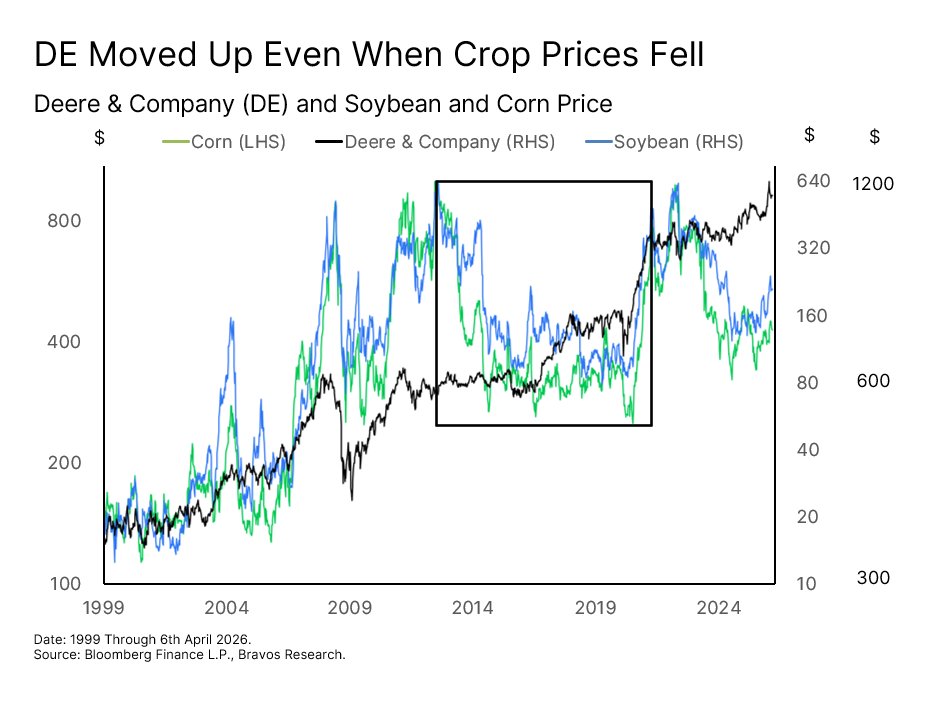
Deere's See and Spray technology delivered a 59% reduction in herbicide usage by using cameras and AI to spray only where needed. That kind of precision becomes an essential margin protection tool for farmers in this environment. This also helps build loyal customers, making the stock price resilient even when crop prices fall, like in 2012-2020.
Deere is also targeting 24/7 fully autonomous systems by 2030 without the need for a driver. The company is effectively transforming into a recurring, high-margin agricultural technology platform that is yet to be fully reflected in its 32.3x valuation.
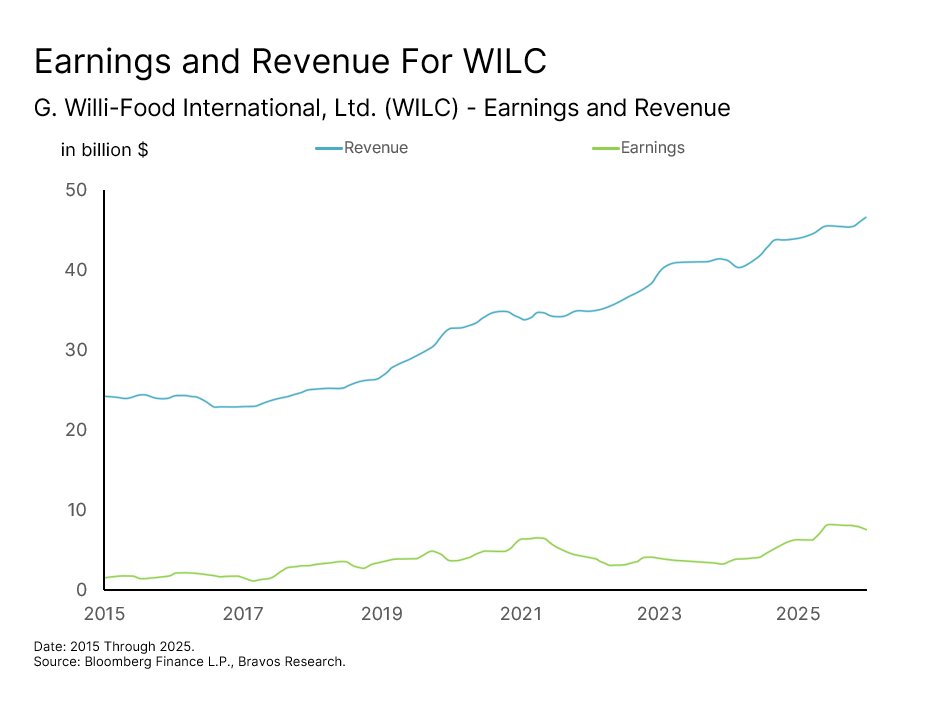
Willi-Food International Ltd. (WILC): Highly Profitable, Strong Growth and a Regulatory Moat
Willi-Food operates at a cultural and regulatory bottleneck in the global food system — the kosher food market. Kosher certification takes years to build and creates a customer base that won’t switch to a non-kosher alternative. The certification is part of what they are buying, making demand uniquely price-insensitive. The result: earnings grew 28.6% to a record $28.4M in 2025 during a period of broad agricultural market weakness.
A $35M self-funded refrigerated and frozen logistics center coming online in Q4 2026 opens categories where WILC faces limited certified competition. The facility also enables WILC's proprietary dairy brand to scale into frozen distribution, thus capturing margins at two points in the value chain.
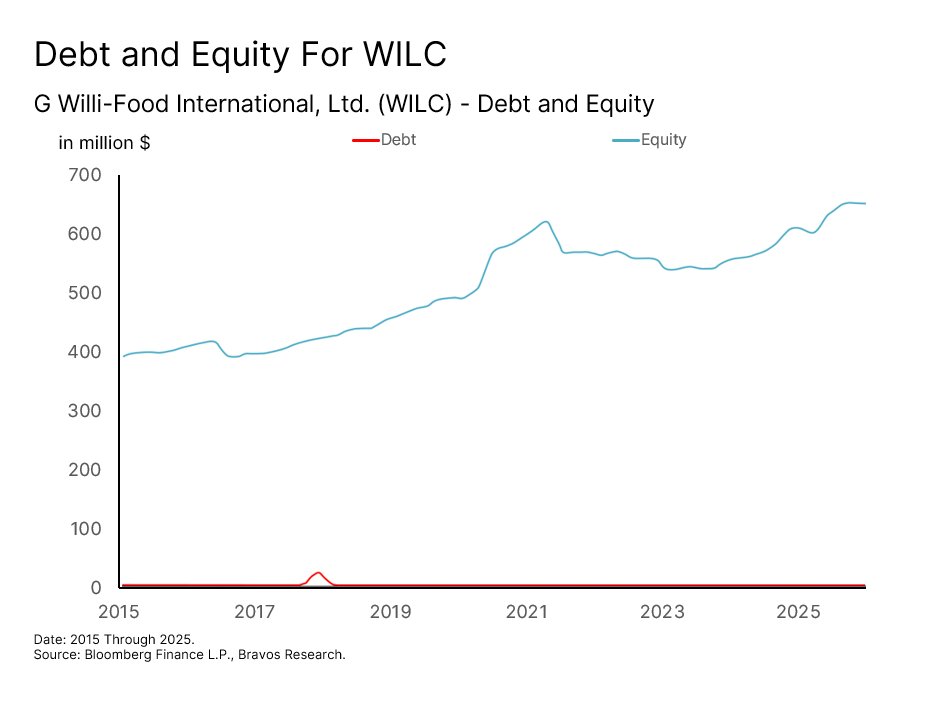
WILC still holds $122M in cash with zero debt even after funding all expansions internally. Meaning, 35 cents of every $1 invested in the stock is backed by cash. Yet, the stock is significantly undervalued at 12.2x PE, less than half its peer average of 26.5x.
CF Industries (CF): The Lowest-Cost Producer of the World's Most Essential Crop Input
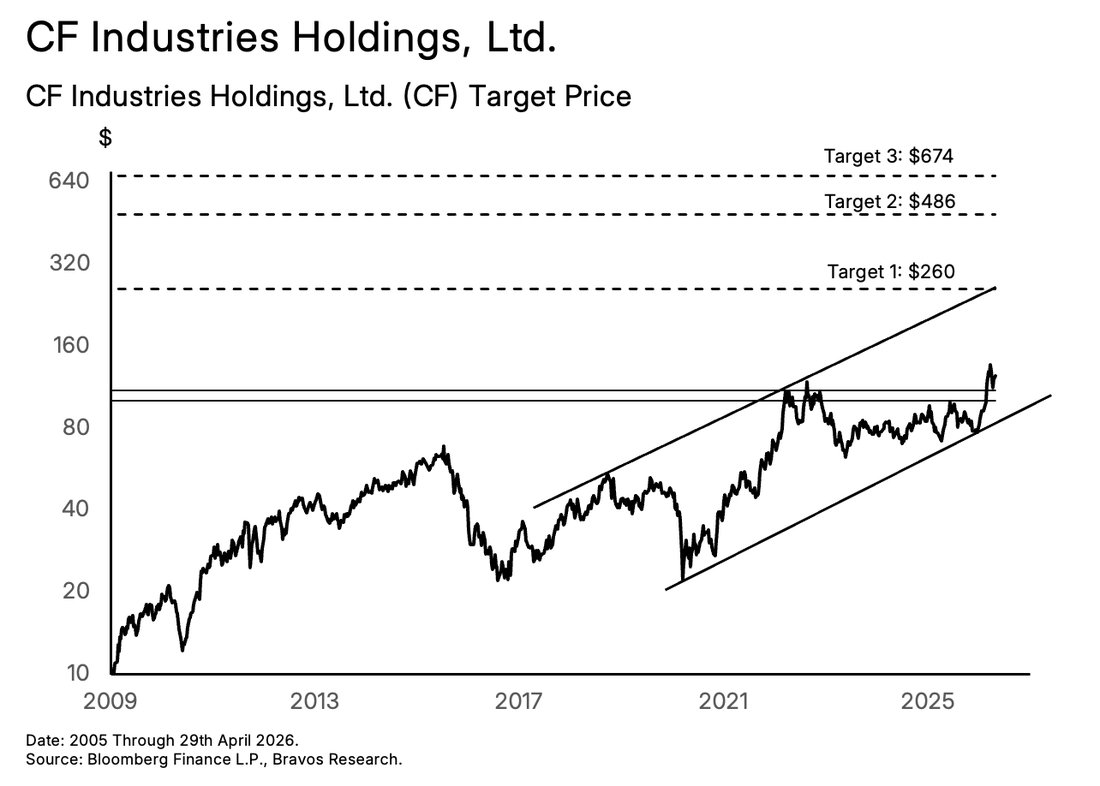
CF Industries is the world's largest ammonia producer, needed to produce every single nitrogen fertilizer. Ammonia production is natural gas-intensive. CF sources gas at $3.36 while its European & Asian competitors pay $10–15. CF’s production costs are largely fixed. So when nitrogen prices rise, the extra revenue translates almost entirely to profits. That’s why CF closely tracks nitrogen-based fertilizers like urea that we also believe has embarked on a large run.
CF is expanding its operations by opening new facilities for low-carbon ammonia, which will provide additional tailwinds to earnings.CF has outperformed the broader agricultural sector by 50% this year alone. But at a 14.1x PE against a peer average of 29x and a 2021 peak of 40.2x, CF still has room for significant repricing.
Oil Shock & 1970s Risk
Why the current oil spike could echo the 1970s stagflation regime.
Oil Shock Increases Risk of 1970s Repeat Despite a potential ceasefire in the works, oil prices have risen by over 40% since the beginning of March 2026. We work with the data that is in front of us and oil prices around $80 a barrel are going to have profound consequences on the economy through inflation and growth.
The US inflation rate (CPI) is released with a 1-month lag, so the March print (released in early April) that came in at 3.3% is the first real look at where things actually stand. But even then, a higher oil price takes multiple months to work through the economy as it feeds into the cost of almost everything.
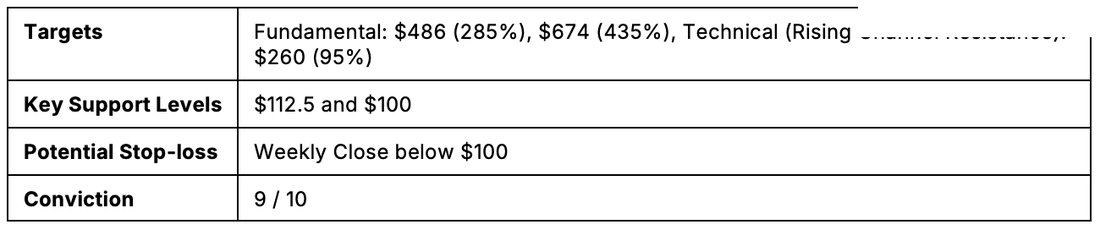
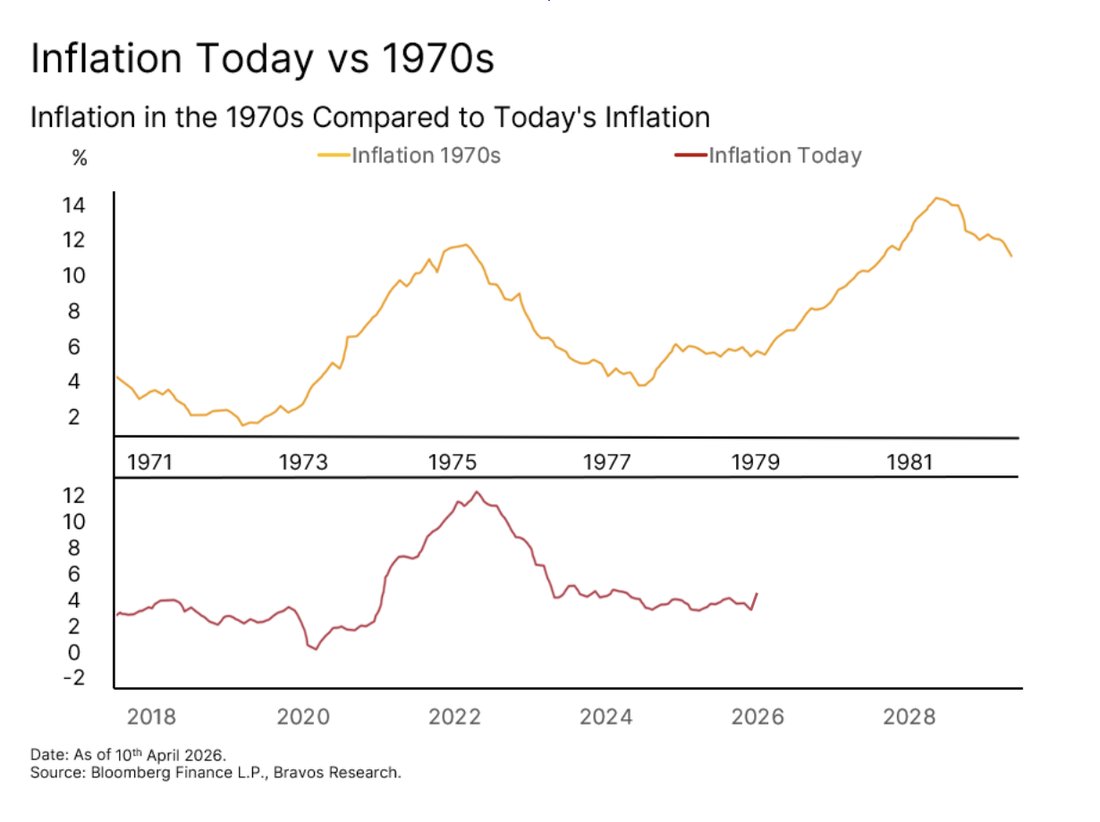
Inflation has been running above the Federal Reserve’s 2% target for 60 consecutive months now. The last time inflation stayed this stubborn this long was the 1960s and 1970s. This was a period that also saw oil rise aggressively, with CPI closely tracking oil prices.
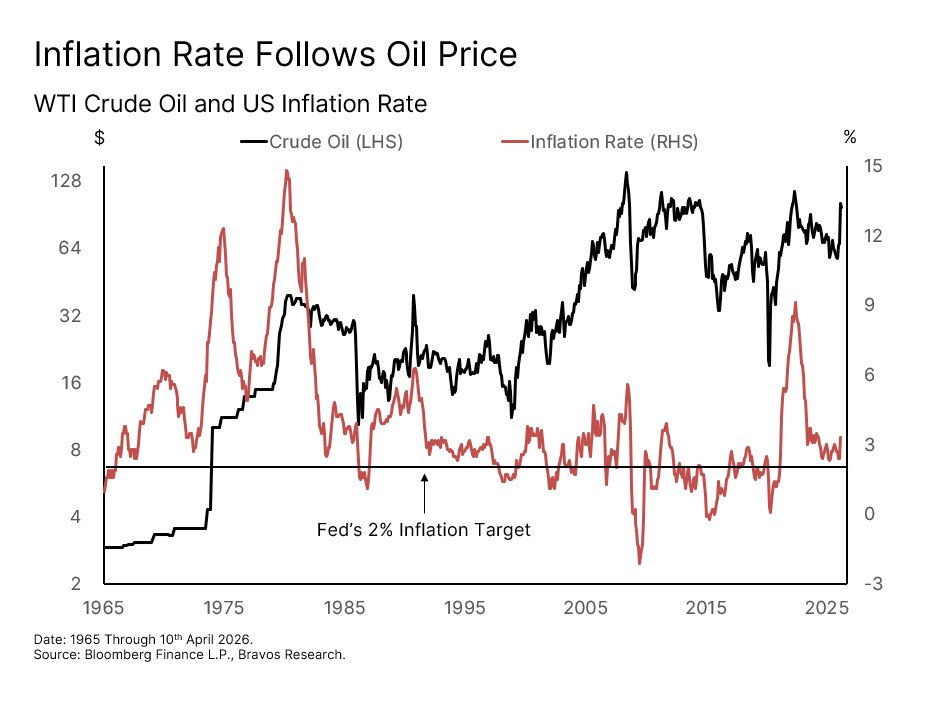
That era saw inflation rise in three distinct waves. First in the late-1960s following the onset of the Vietnam war, again in 1973 during the Arab oil embargo, and a third time in
late-1970s heading into the Iranian Revolution. Each time, inflation appeared to cool before surging again even higher. Today's inflation trajectory looks remarkably similar. CPI spiked in 2021 after the record money printing post-Pandemic, then pulled back, and is now right at the point where the 1970s saw its second wave begin. So what can a 50% oil spike actually do to inflation?
Energy only makes up around 6% of the CPI basket, but it is the most volatile component by far. That means big moves in oil have an outsized impact on inflation relative to its weight. A 50% rise in energy prices, if sustained, has the potential to add approximately 3% to headline CPI on its own (50% × 6% = 3%). Starting from the 2.4% baseline prior to the oil shock, that alone would push inflation to around 5.4%. And we just saw the first signs of this, with inflation accelerating from 2.4% to 3.3% in April.
But energy doesn't hit the economy all at once. Different parts of the economy absorb it at different speeds. Gasoline prices at the pump typically react within days. Fresh produce and dairy prices usually take 4 to 8 weeks to reflect higher energy costs. Whereas shelter costs can take 6 to 12 months to fully adjust. So even if only half of today’s oil shock feeds through in the near term, that still brings CPI to almost 4% by Q2 2026. This would be twice the Fed’s 2% target leaving them in a very difficult position.
But it would also have significant economic consequences.
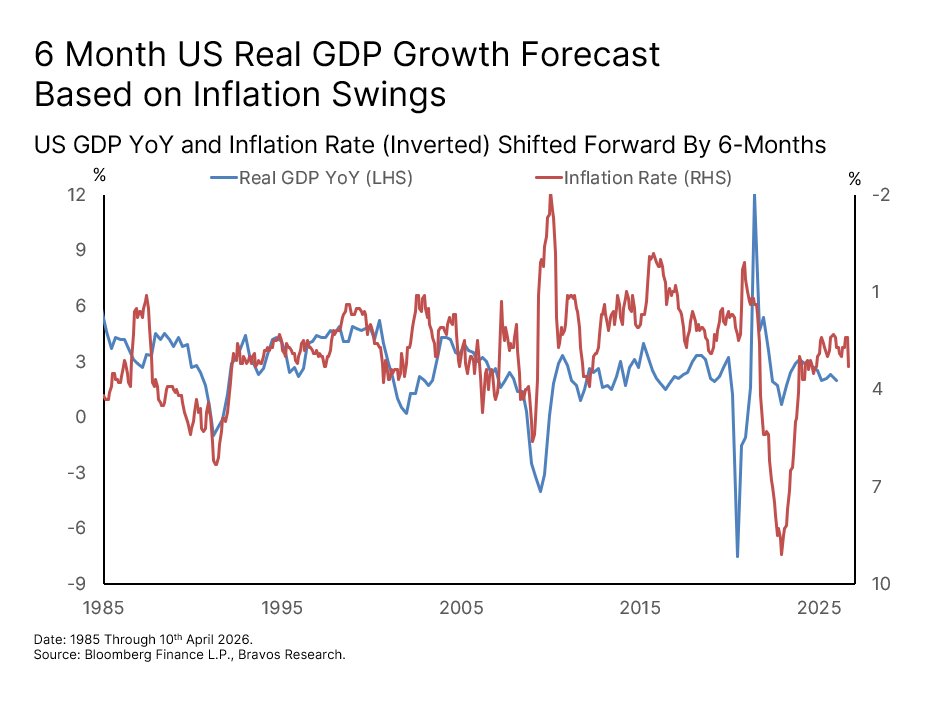
Oil Spike Drags Economic Growth and Increases Recession Risks Since the mid-1980s, inflation has led economic growth by approximately 6 months. As this chart shows, every major inflation spike has been followed by a meaningful slowdown in US GDP growth with roughly that lag (Note: Inflation has been inverted on the chart). So the growth impact of an inflation spike in Q2 2026 won't accurately show up in GDP data until late-2026/early-2027. But by then, the damage to consumer spending and corporate margins would likely be well underway. In fact, if oil prices stay elevated long enough, it’s also possible that the economy rolls over into a recession. And this wouldn’t be the first time we see something like this happen.
Pretty much every oil shock that crossed the 30% level on this model has preceded a US recession. The 1973 Arab embargo, the 1979 Iranian Revolution, the 1990 Gulf War, the 2000 Dot Com bust, and the 2008 housing collapse were all accompanied or preceded by a sharp rise in oil prices. The only exception was 2022. Back then, the consumer was exceptionally resilient as a result of high savings and stimulus money from the Pandemic. That cushion helped absorb the shock. But that buffer has since been used up.
The current oil shock is already beginning to resemble some of the prior recession-triggering episodes. If oil remains around the $80 to $90 level for approximately two more months, it will cross the 30% threshold on this model that’s been a reliable precursor to past recessions.
It's important to note that even if oil prices decline significantly from these levels, it would not resolve the broader inflation problem. As we will discuss later in this report, the inflationary pressures building in this environment run far deeper than the price of a single commodity. In other words, they are structural in nature.

Oil Shock Hits the Economy Through Three Channels
What makes an oil shock particularly damaging is that it impacts the economy through three simultaneous channels that compound each other.
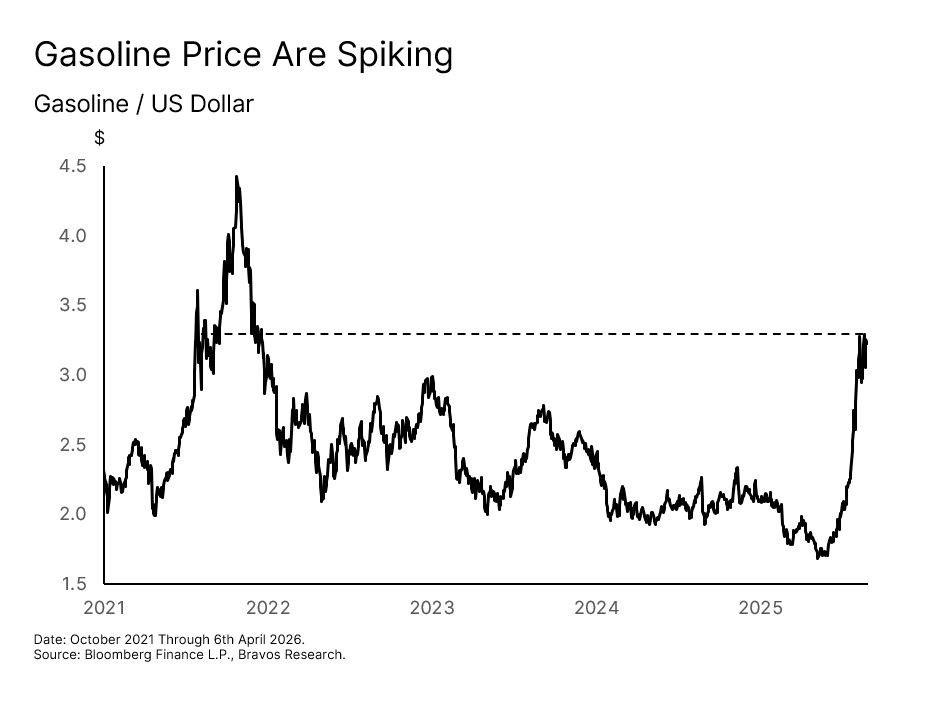
Channel 1: Rising Gasoline Prices The first is the direct channel that’s the most visible. Gasoline prices have already doubled since the start of 2026, reaching the highest level since the 2022 oil shock. This functions as an immediate tax on every household and business that relies on transportation. For example, every sustained $10 per barrel increase in oil translates into
roughly $450 in additional annual costs for the average US household. And this is before any second-order effects work their way through the economy.
That said, if oil prices were to pull back meaningfully below $80, this direct pressure on household budgets would ease considerably and could become a tailwind for the markets. What it would not change, however, is the longer-term commodity story we will outline later in this report.
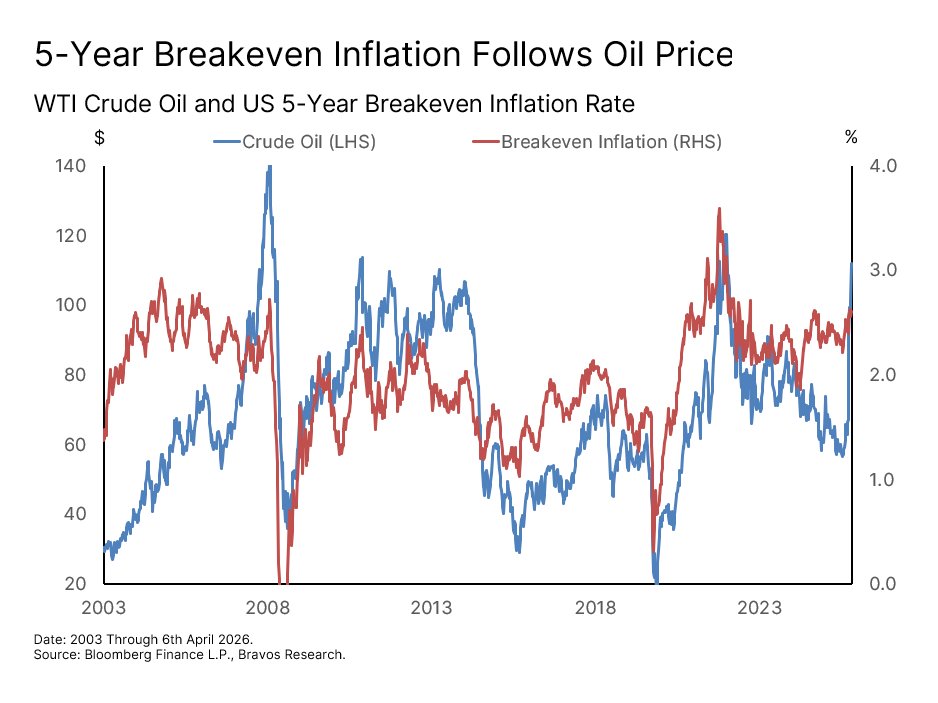
Channel 2: Higher Yields The second channel is an indirect one that works through the bond market. Inflation expectations have historically been closely correlated with oil prices. When inflation expectations rise, bond yields tend to rise with them. This puts upwards pressure on borrowing costs and mortgage rates.
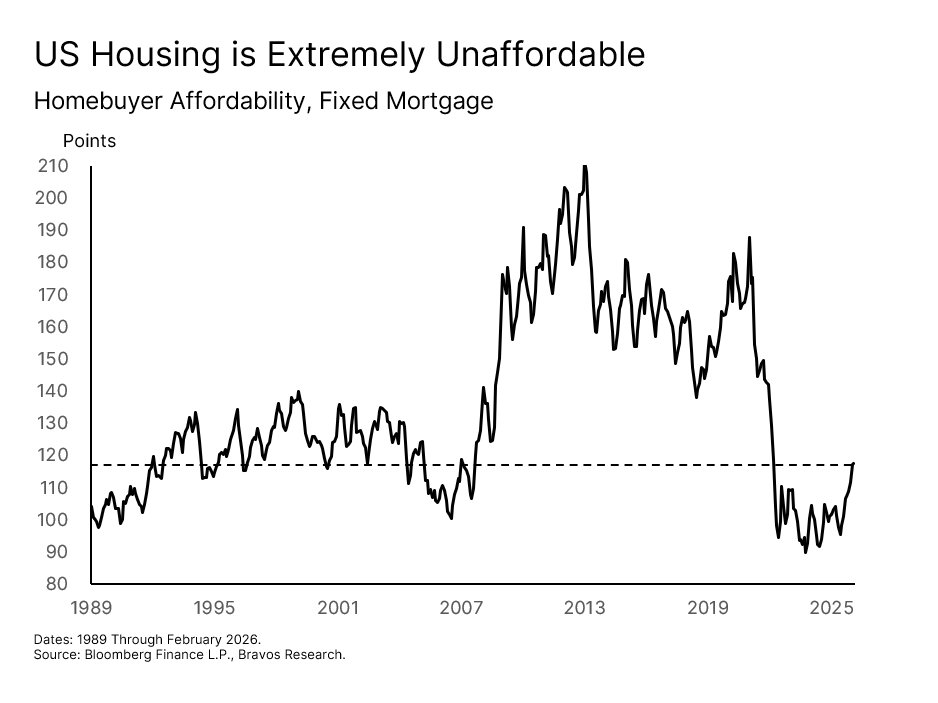
Housing alone makes up 33.4% of the average household budget, which is by far the single largest expense for most Americans. The 30-year mortgage rate has already moved from 6% to 6.4% since March 2026. The worst part is this is happening at a time when housing affordability is still sitting at some of the lowest levels since 1989. A household that could barely afford a home at 6% now faces an even higher bar. So every further move up in yields driven by rising inflation expectations adds a second major squeeze on top of the one already coming from the gas pump. However, a sustained drop in oil prices would relieve some of this pressure on yields and mortgage rates, reducing the risk of a prolonged economic slowdown.
Channel 3: Monetary Policy Fix The third channel is what makes this oil shock particularly dangerous from a monetary policy standpoint. When inflation is rising and the economy is weakening at the same time, the Fed gets caught in a trap. Raising rates to fight inflation risks pushing an already slowing economy over the edge. Whereas cutting rates to support growth risks letting inflation run even higher. The result is paralysis at exactly the moment the economy needs a clear direction.
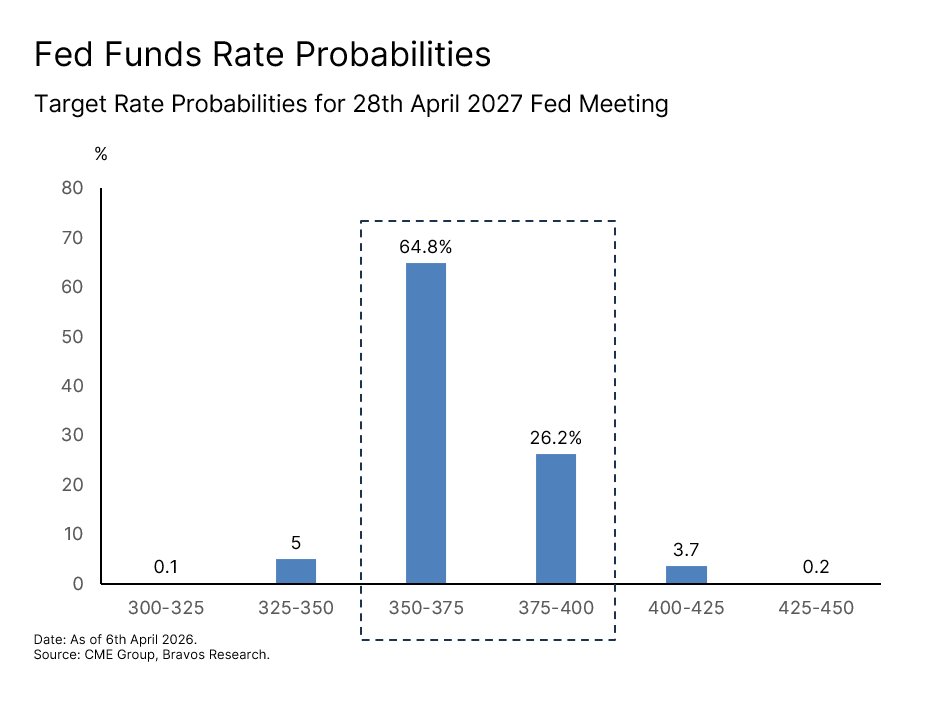
Just a few months ago when oil prices were low, the markets were anticipating at least 2-3 rate cuts in 2026. But investors are now pricing in a 65% chance of only one rate cut in the next year, with a 26% chance of a rate hike instead. This is a complete 180-degree turn and could significantly impact the real economy.
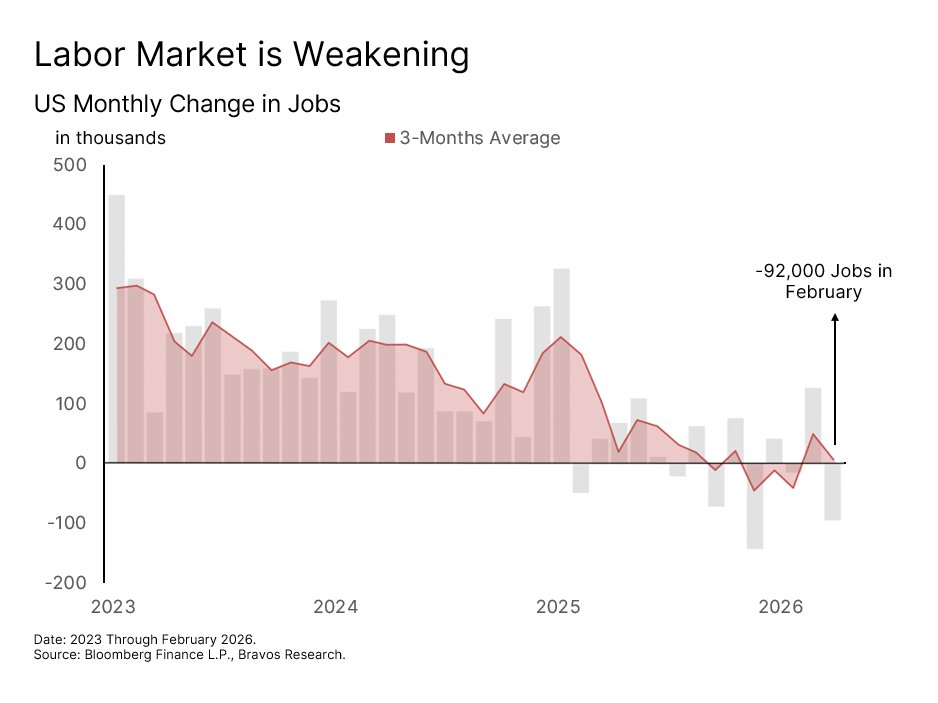
Weak Labor Market Increases Economic Slowdown Risks
The labor market was already showing cracks even before the recent oil shock. For instance, the US private sector added only 116,000 jobs across all of 2025. This is 80% below the initial projections. More recently, 92,000 jobs were lost in February 2026 alone. Holding or hiking rates into a weakening labor market is precisely the kind of policy that risks turning a slowdown into a recession.
If oil retreats from significantly below $80 though, the Fed's dilemma eases, rate cut expectations would likely return due to a weak labor market, and the financial markets could see a meaningful rally. We want to be clear that this is a real possibility. The recession risk we are describing is conditional on oil staying elevated. But what remains intact regardless of where oil goes in the near term is the broader commodity cycle we are in.
Three Compounding Forces Further Amplify Drag on Economic Growth When all three channels we discussed earlier operate at the same time, they can feed on each other in a way that becomes self-reinforcing. Higher energy costs and rising borrowing rates force households to cut back on discretionary spending. Businesses facing higher input costs and weaker demand respond by freezing hiring and eventually laying people off to protect margins. Fewer employed consumers spend even less, creating a negative feedback loop.
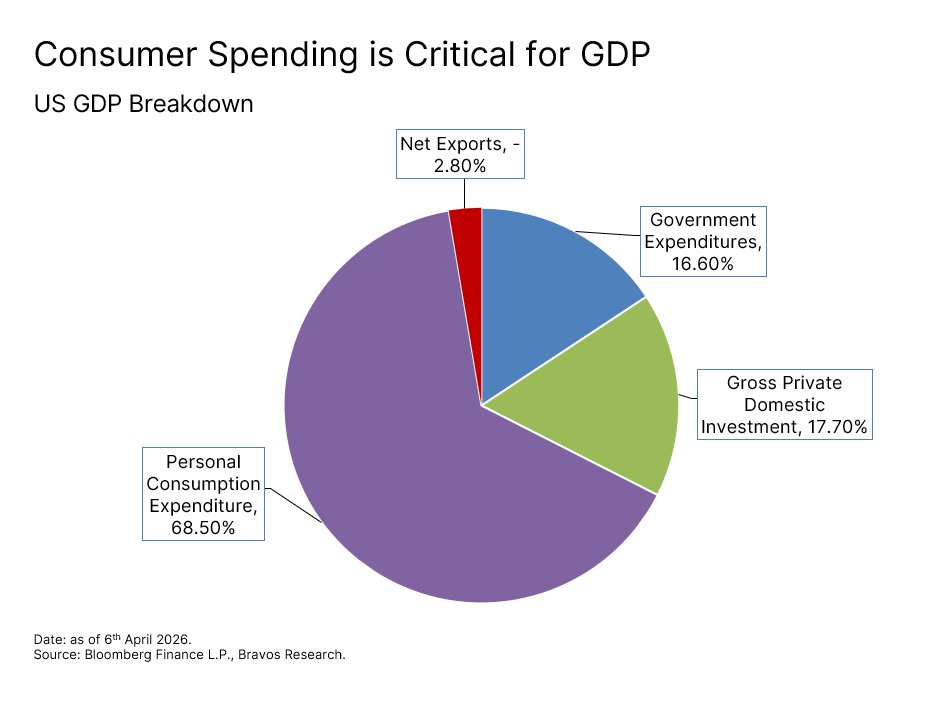
This is the same sequence that turned the 2022 energy shock into 2 consecutive quarters of negative US GDP growth. But the consumer entering 2026 is in a much weaker position than they were back then. Savings have been drawn down, credit card debt is at record highs, and low-income default rate has been rising rapidly. This matters a lot because the US consumer accounts for almost 70% of GDP. So any sustained squeeze on household spending directly translates into broader economic weakness. All of this is of course dependent on oil staying elevated above $80. But we also have to put all of this in the broader context as well.
Commodity Cycle
Where we are in the long commodity cycle and why equities and commodities can both rise.
The Commodity Cycle is Turning Regardless of What Happens With the Middle East War For the last decade, we’ve been in a macro environment where there have been little concerns regarding the scarcity of commodities. Prices were low, supply felt abundant, and investors rotated away from real assets towards other areas of the market. That is beginning to shift in a major way.
We saw the first big wave of this in 2022, when the Russia-Ukraine war triggered a broad repricing across commodities. But now a second wave appears to be underway. To understand why this one could be more sustained, it helps to look at where we are in the longer commodity cycle.
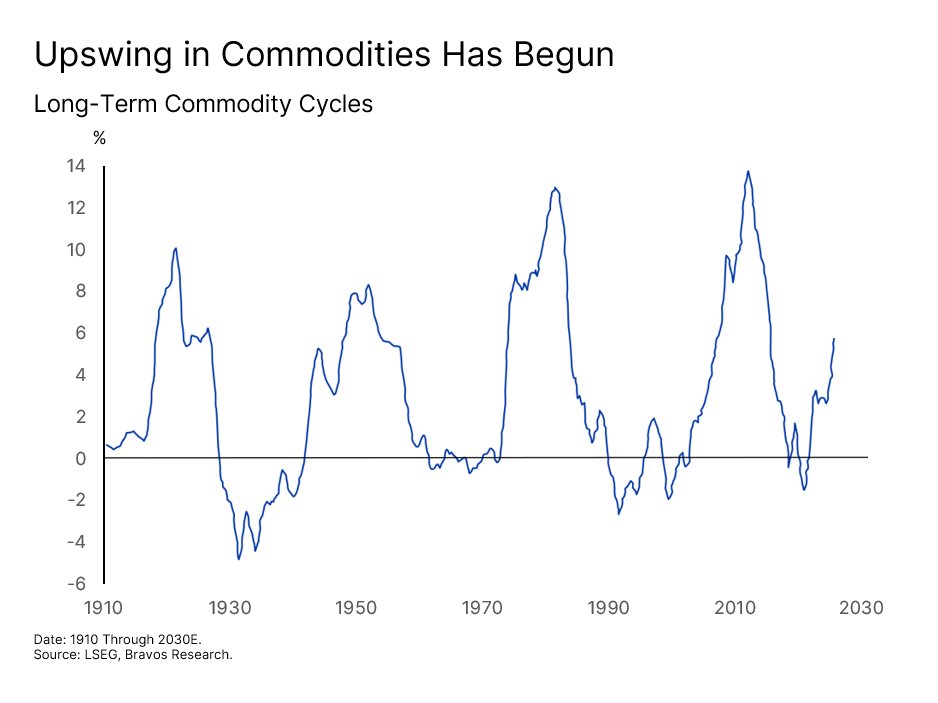
In the past 100 years of data, commodity cycles have proven to last between 10 to 20 years. The most recent trough came in 2020. If history is any guide, the current cycle likely has a runway until 2030 at least. So the commodity cycle has already been showing signs of structurally turning even before the Middle East war. In other words, the ongoing geopolitical tensions does not change anything about the structural nature of the commodities bull market we are experiencing.
Commodity and Equity Bull Markets Can Coexist
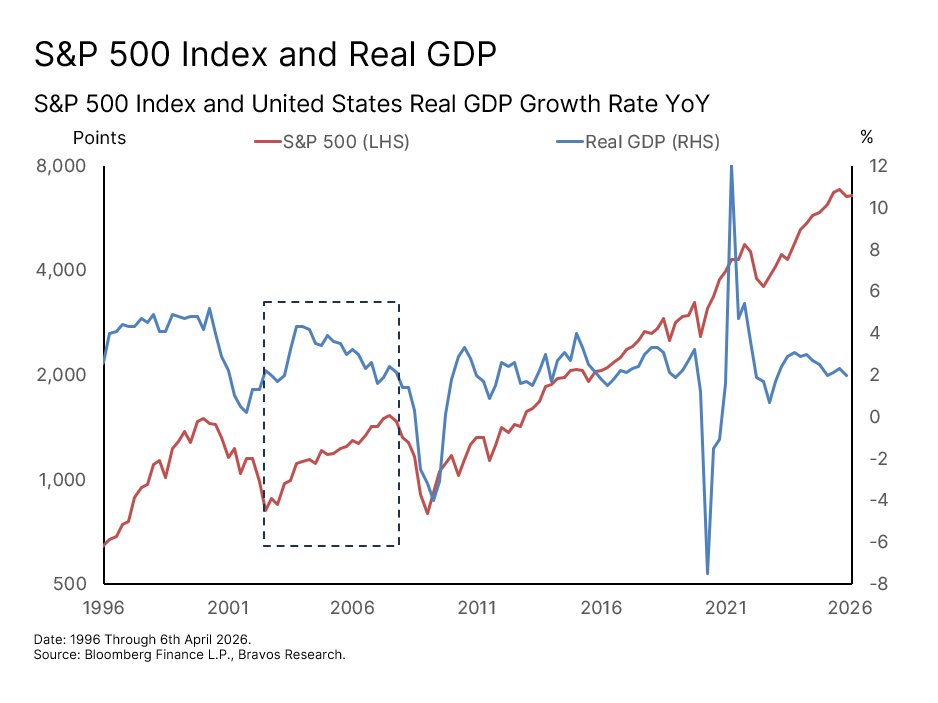
This is not all bad news for the economy or the financial markets though. Part of the last commodity cycle in the 2000s actually coincided with a period of stable US economic growth. Between 2002 and 2007, US GDP averaged a healthy 2.8%. This also coincided with a strong equity market performance, with the S&P 500 rising 85%. So based on history, a commodity cycle and an equity bull market can absolutely coexist.
If there is a material turnaround in the price of oil, everything that was highlighted above will be reversed and the secular bull market that we've been in since 2009 will continue.
Corporate Tax Structure Ends Secular Equity Bull Markets
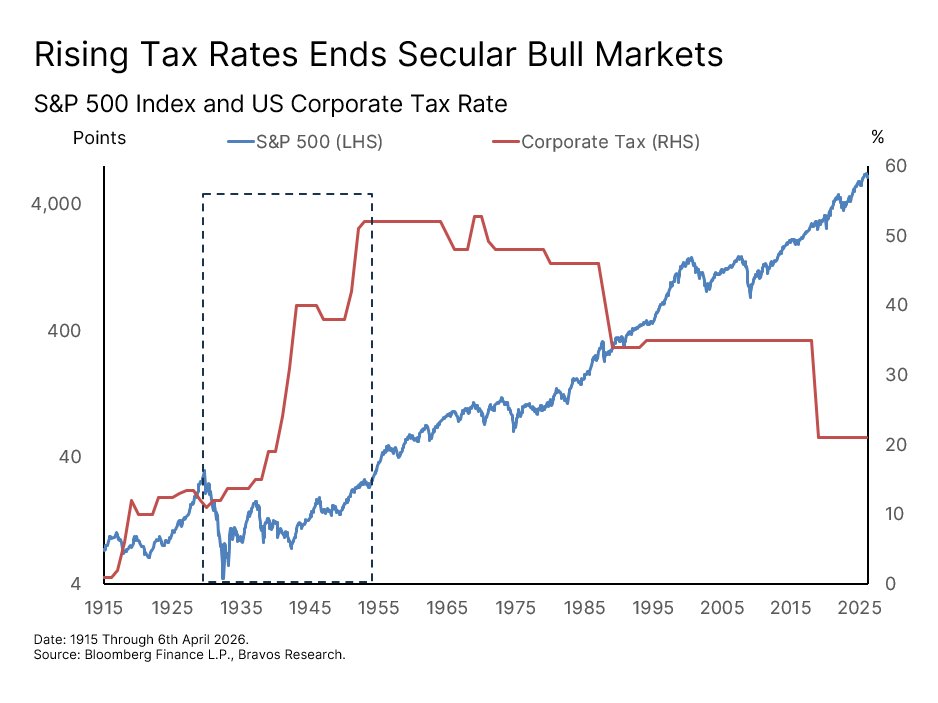
A large part of what drives secular bull markets in stocks is a favorable corporate profit environment. That still largely remains intact today. Corporate tax rates are at the lowest levels since the 1940s, which has been supporting strong profit margins. We think the real inflection point for equities will come when this is put in jeopardy, like we saw between late-1920s and mid-1950s.
Commodities are Relatively Much More Attractive Than Equities
Within the current macro backdrop, however, we think the commodity space offers a much more attractive risk/reward opportunity than broader equities right now. One way to see this is through the ratio of commodity prices to equity prices. This ratio is at levels lower than even the early-1970s and late-1990s. Both of those instances were followed by a prolonged period of significant commodity outperformance relative to equities. We appear to be at a third such inflection point today. If this ratio were to simply go from today’s 0.66 level to its 60-year median at 3.8, it would equate to almost a 500% relative outperformance by the commodity market.
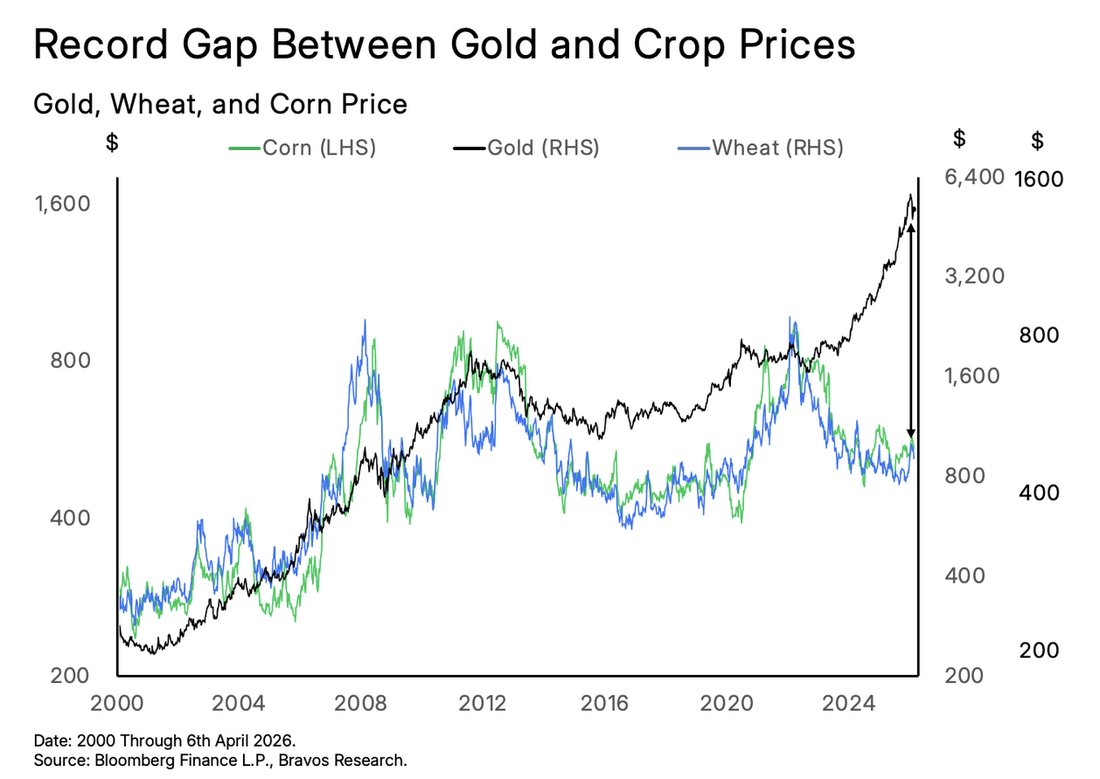
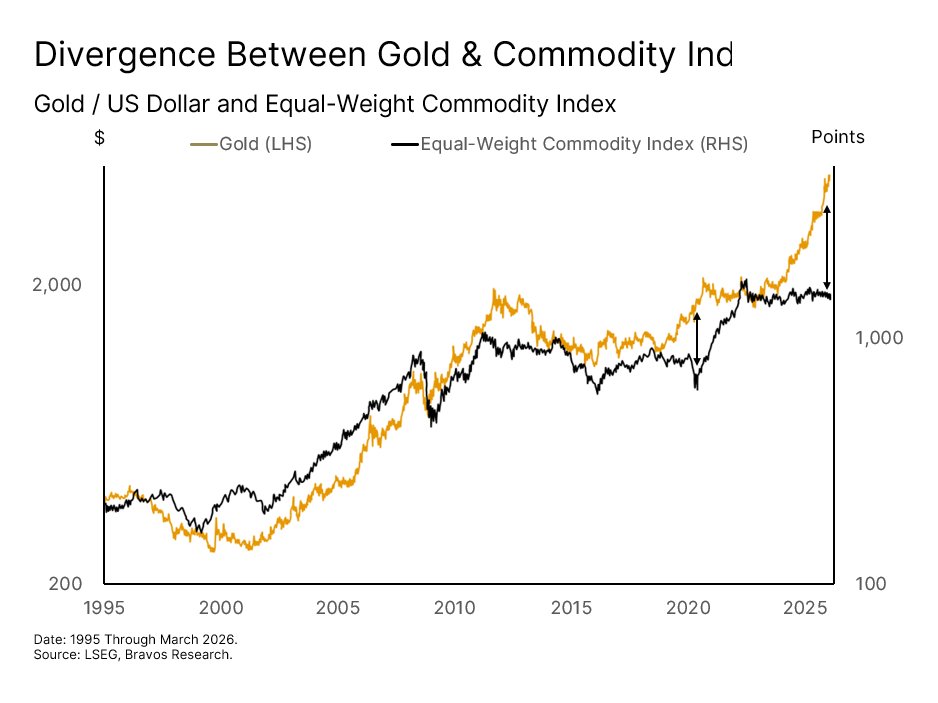
Gold Has Already Tripled, Agricultural Commodities are Next Gold is typically the first commodity to move in a new cycle, with base metals, energy, and agricultural commodities following with a lag. Gold has already tripled over the past three years, the fastest appreciation since the 1970s commodity cycle. This is the market's way of signaling that the US dollar has been effectively debased and investors have lost confidence in its ability to hold its value. This debasement is also likely to set a new price floor for real assets broadly.
The gap between gold and broader commodities is currently at one of its widest levels on record. We also saw a similar divergence between 2019 and 2021, which eventually led to a violent catch-up move by other commodities. With the macro backdrop now shifting in favor of commodities once again, we think this gap provides a major opportunity as it’s unlikely to last much longer.
Agricultural Deep Dive
Why agricultural commodities are next in line after gold.
Out of all the commodities that stand to benefit, agricultural commodities have shown the widest gap against gold's move. For instance, wheat and corn are essentially at the same level as they were in 2013. This makes agricultural commodities the most underpriced part of the commodity complex and therefore the most susceptible to a sharp repricing. The energy shock is now likely to accelerate that process.

Higher energy prices tend to feed into agricultural input costs like fertilizers and transportation with around a 60 to 90 day lag. Only after that do these higher costs trickle through into grain and food prices. So compared to where metals and energy prices already are, the agricultural repricing that has been set in motion is still in its very early stages. As investors, that is precisely where we want to be positioning to maximize our risk-reward.
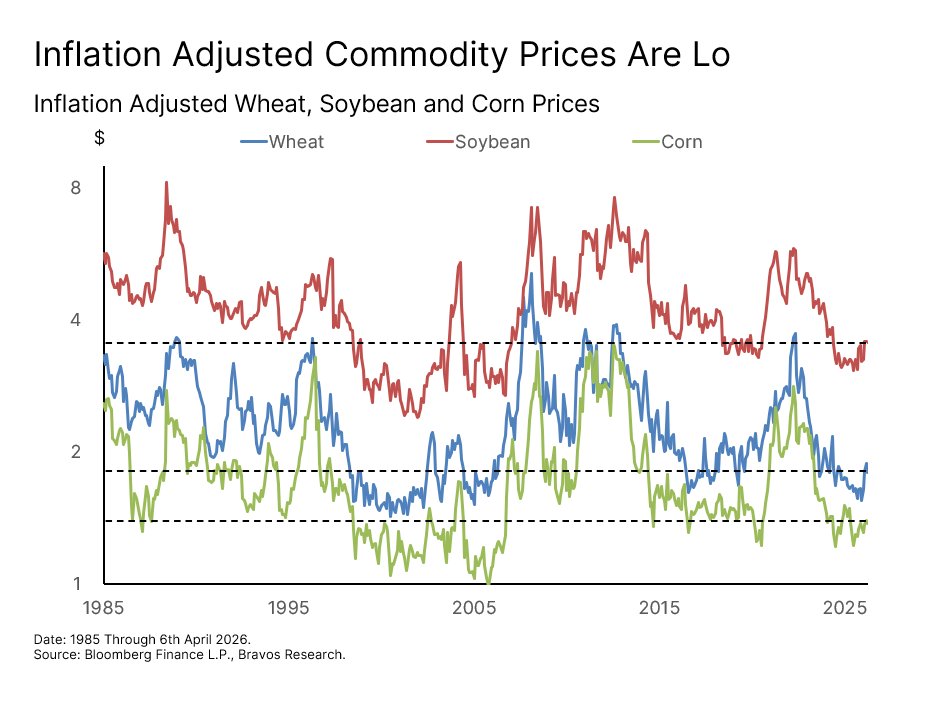
Agricultural Commodities are Very Cheap in Real Terms The inflation-adjusted starting point for agricultural commodities makes this even more compelling. In real terms, crops like wheat, corn, and soybeans are currently trading near their lowest levels since the 1980s. The 2022 commodity spike has fully unwound on an inflation-adjusted basis, leaving all three crops at prices comparable to where they were before the bull runs of the early 2000s and heading into 2022. Both of those instances saw real prices more than double from similar starting points.
What makes today's setup even more attractive is that this cheapness is occurring at the same time as agricultural input costs are rising. The result is a sector that is historically
Supply Constraints
Land, water, and yield ceilings capping agricultural output.
cheap on a real basis at precisely the moment when the broader structural forces driving the next repricing are beginning to accelerate.
To understand why the repricing case is so strong, let’s first look at the supply side. The structural challenge facing agricultural commodities is rooted in a simple physical constraint: land.
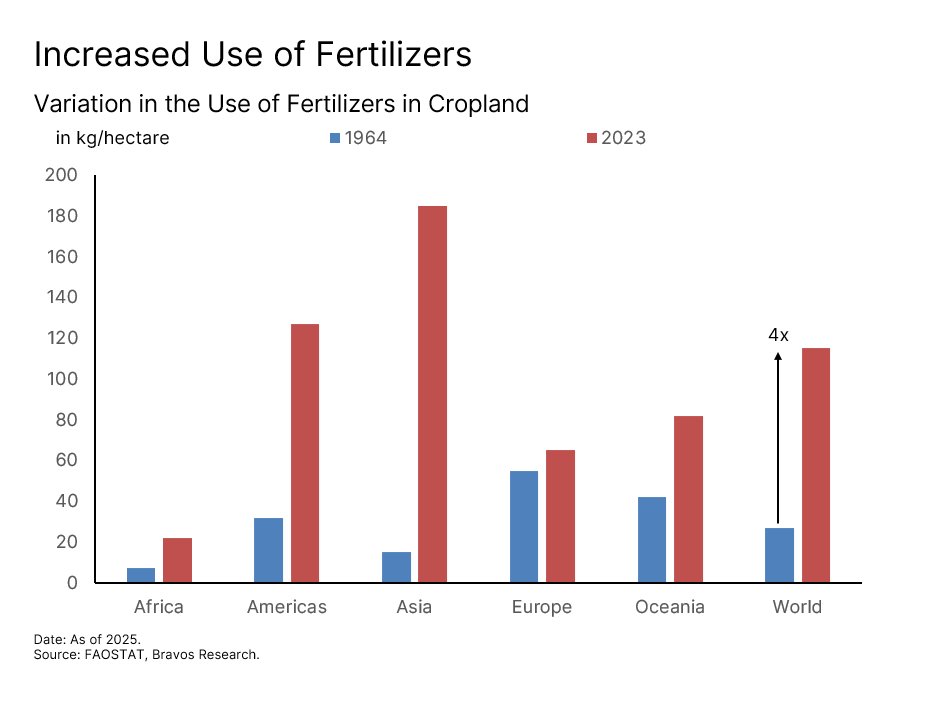
The World is Running Out of Land to Grow More Food
Since 1992, the amount of farmland available per person has fallen 27%. During this period, total agricultural production has still managed to nearly double. Now that may look like a success story at first, but there’s a nuance to this. None of those gains came from bringing new land into production. Instead, 90% of all production increases came entirely from intensifying how existing land was used. This was done through higher-yielding crop varieties, expanded irrigation, and above all, the increasing use of fertilizers.
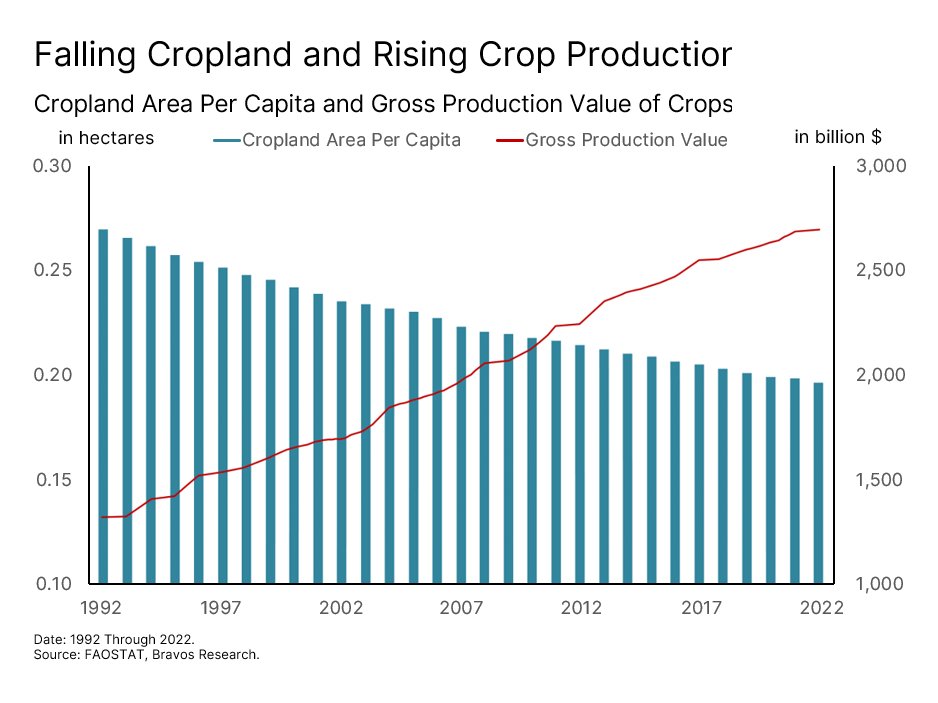
Fertilizer use per acre of farmland is now more than four times what it was in 1964. And future production growth must also continue coming from this same intensification path because there is simply no new land left to bring into production. The problem is that the economics of intensification are breaking down. You cannot keep pushing yields higher when the cost of the inputs needed to do so rises faster than the price you get for the crop. At some point, it stops making financial sense. We think that point is fast approaching.
Moreover, this path is also hitting physical limits. Aspects like water stress, soil degradation, and the cost of maintaining intensification-driven yields on the same land are all compounding the problem.
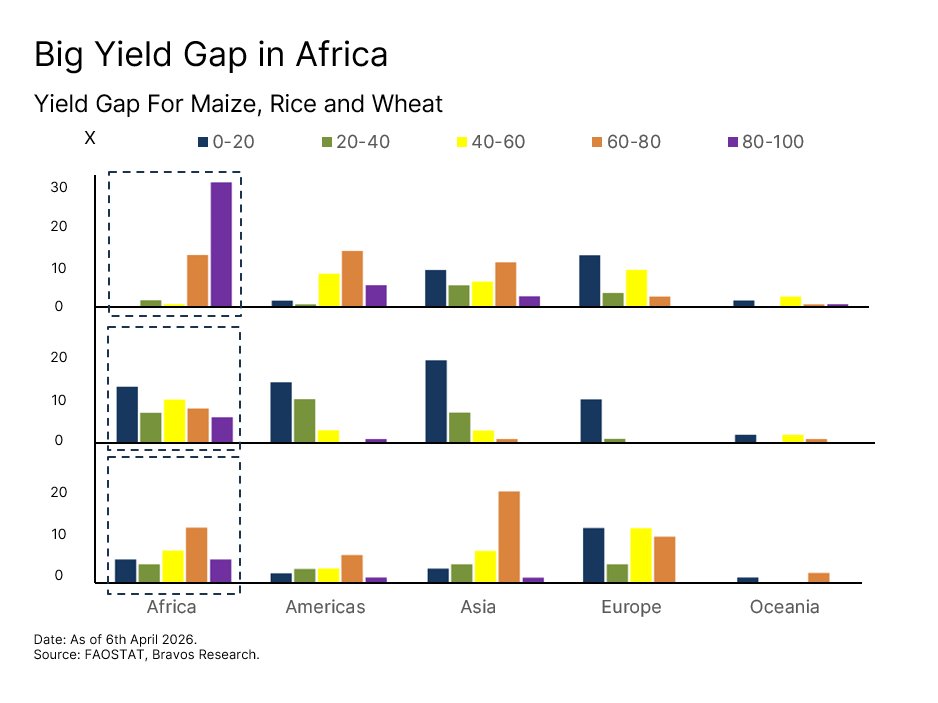
Africa is the one remaining region where meaningful agricultural expansion is still possible. The vast majority of the continent still faces severe yield gaps across maize, rice, and wheat. Simply put, their actual harvests are running at less than 40% of what the land could theoretically produce under proper resources. But expanding production there requires exactly the inputs (seeds, fertilizers, transportation) that are becoming more expensive and harder to source globally. This creates a structural paradox. The one place on earth with genuine room to grow food supply is also the place least able to afford what it takes to do so.
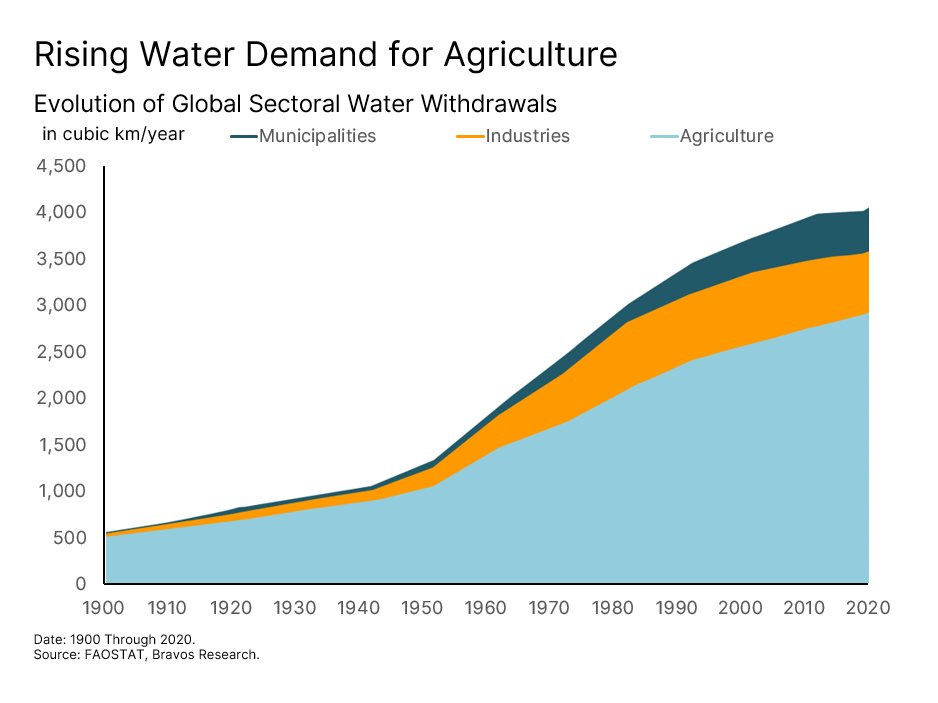
Water Scarcity Is Capping Agricultural Supply Growth Even where agricultural production is well-established today, a key foundation supporting it is eroding quickly. Agriculture accounts for 72% of all global freshwater withdrawals, more than industries and households combined. The problem is that much of this water is being drawn from sources that are not replenishing fast enough.
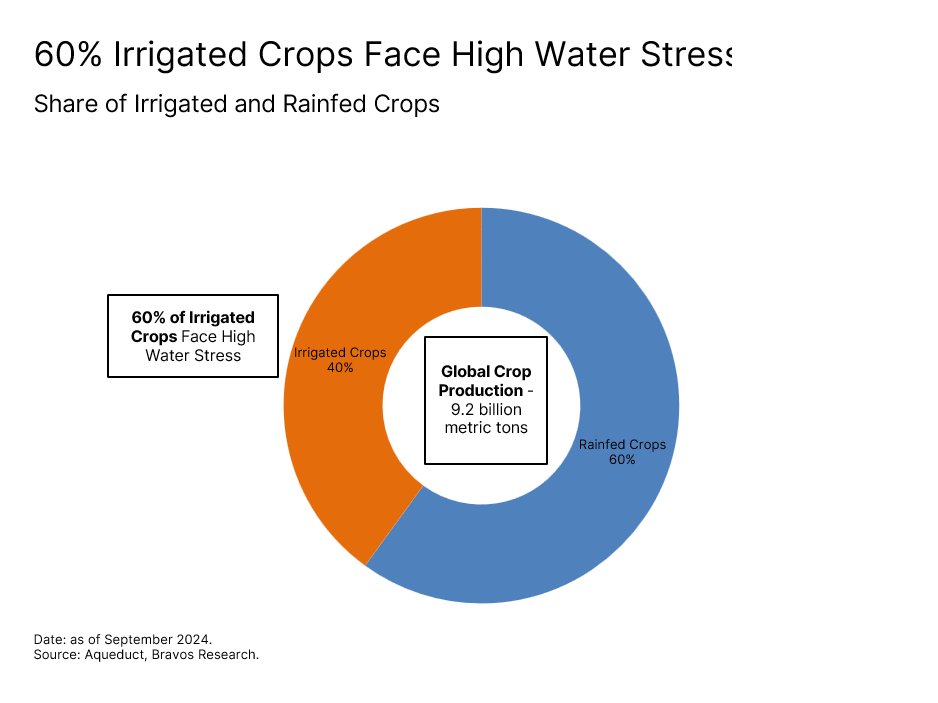
Around 60% of all irrigated crops are currently grown in areas already facing high or extremely high water stress. For example, India pumps non-renewable groundwater to irrigate 270 million metric tons of crops, about 24% of its total production. At the same time, demand for irrigation water is projected to rise another 16% in just the next two decades. In other words, a large part of the yield gains of the past 60 years were built on water supply being abundant, but that has now come to an end.
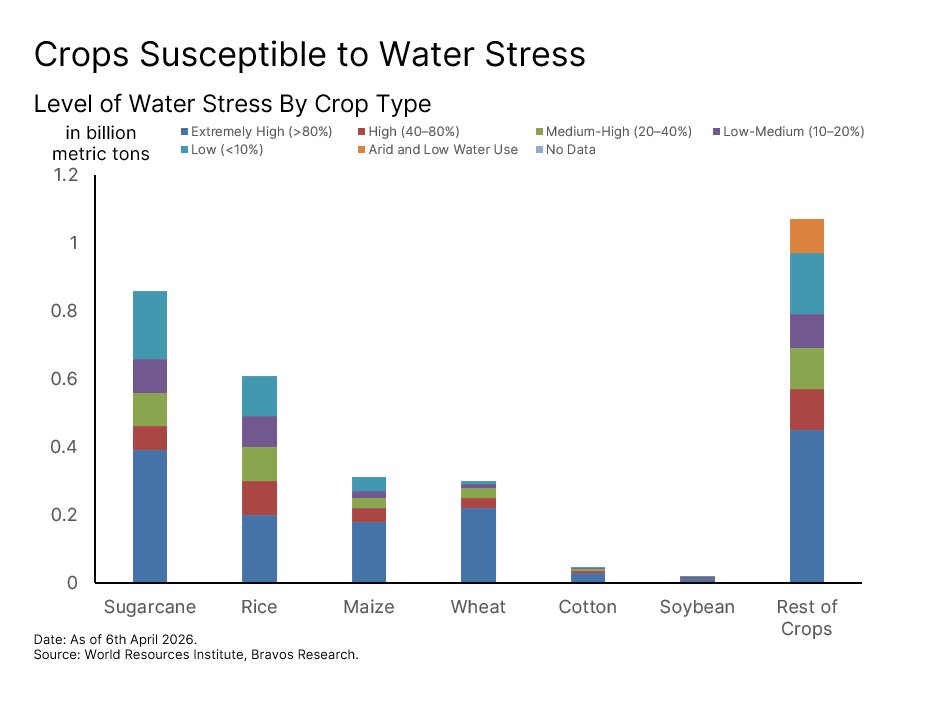
A 2026 UN report has formally declared that the world has entered an era of "global water bankruptcy.” Of course, different crops will be affected at varying intensity due to this, with sugarcane, rice, maize, wheat, and cotton being the five most vulnerable crops. But overall, this is a structural constraint on agricultural supply that is still being overlooked by the market that’s more focused on near-term dynamics like geopolitics.
Demand Forces
Population, diet, and biofuel mandates driving structural demand.
Food Demand is Growing Faster Than Supply Can Keep Up While supply is running into these structural walls, demand is moving in the opposite direction. Global food demand is projected to grow between 35% to 56% by 2050. But the population growth number this is based on actually understates the challenge.
As incomes rise across the developing world, diets shift toward meat and protein. Global meat consumption alone is projected to grow 14% through 2030. This matters because meat production is extremely resource intensive. It takes approximately 50 calories of animal feed to produce a single calorie of beef. So the world doesn't just need more food for people, but also to feed the animals that are then used as food.
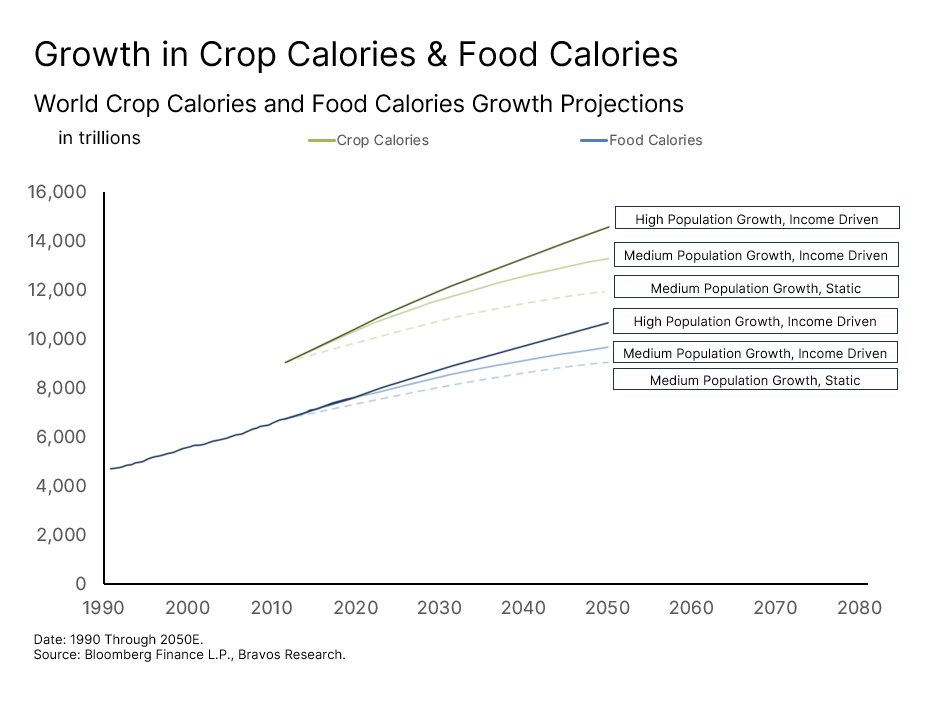
The result is that the true demand on global agriculture is much larger than headline food consumption figures suggest. Crop calories, which capture everything agriculture must produce including animal feed, need to grow far more than the food calories people actually eat.
As the chart below shows, under every scenario modeled (whether population grows fast or slow and whether diets change or not) both crop and food calories rise sharply through 2050. There is no plausible path to meeting that demand without a significant increase in agricultural output. Yet the system being asked to deliver it is already running out of land, water, and affordable inputs.
Crops are Now Feeding the World and Fueling It at the Same Time What makes today's demand picture even more complex is that food is no longer the only source of it. For most of the 20th century, agricultural commodity prices were driven almost entirely by food supply, food demand, and weather. That has now fundamentally changed.
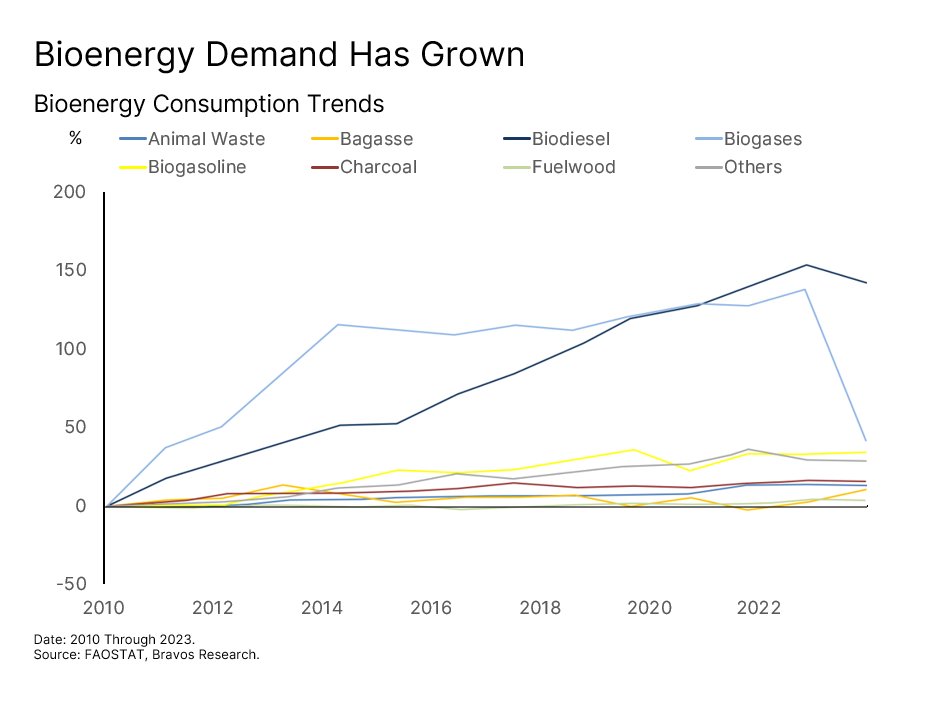
Today, corn and soybeans are simultaneously food and animal feed, but also biofuel feedstocks. Biodiesel in particular has been the fastest growing source of demand within this mix. This is not just a market-driven trend, but also a policy-driven one. Governments across the US, Brazil, and Europe have mandated that a growing share of their fuel supply must come from biological sources. That has turned agricultural commodities into an energy product with a demand floor that’s now backed by law.
Unlike regular food demand, this cannot be “switched off” even if crop prices rise. That’s because the economics here are driven by policy incentives rather than the price of the crop itself.
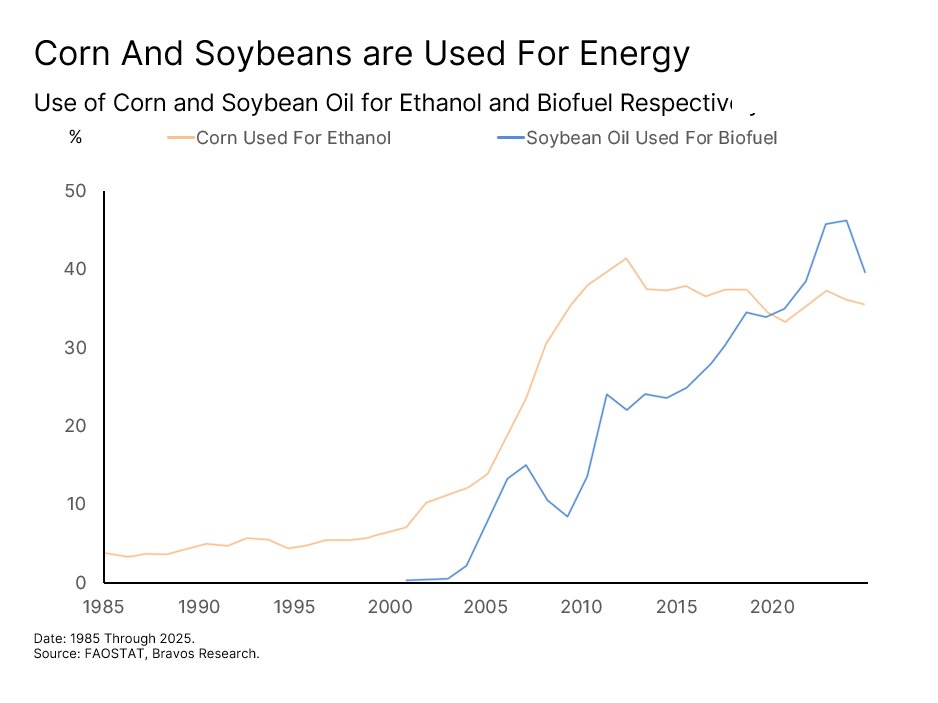
History already shows just how powerful this dynamic can be. Between 2005 and 2012, inflation-adjusted corn prices rose by 193%, driven by government mandates that significantly increased demand for ethanol biofuel. Today, the mandate structure is even larger and more entrenched.
The Environmental Protection Agency’s 2026 biofuel blending mandate has come in well above earlier proposals. Biodiesel and renewable diesel production are required to increase their blending mix by 60% from 2025 levels. Approximately 36% of the entire US corn crop now goes to ethanol production and 40% of soybean oil goes to biodiesel. These have become structural demand floors baked into the economics of the biofuel energy sector. What this means in practice is that a bad growing season no longer just creates a food shortage, but simultaneously creates a biofuel energy shortage.
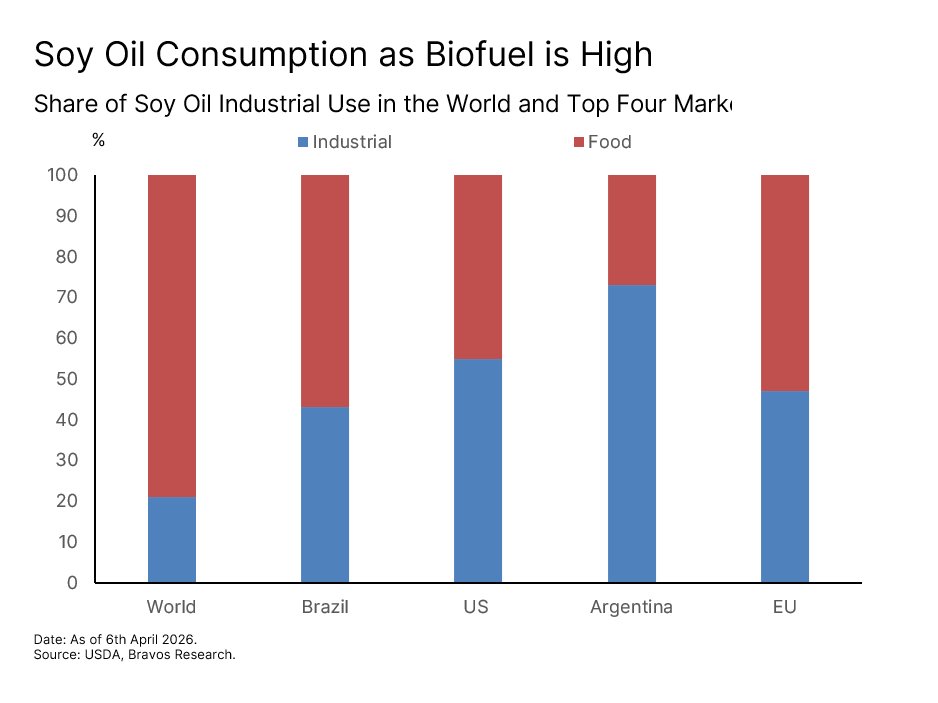
Soybeans are the clearest example of how this convergence has taken hold. In the US, Argentina, Brazil, and the EU, biofuel already accounts for 40% to 70% of total soybean oil consumption. This creates a direct mechanical link between energy prices and food prices.
When energy prices rise, the economics of biofuel improve, which pulls more soybean oil toward fuel rather than food. This tightens food supply further even without any change in crop production. The result is that soybeans now sit at the intersection of three independent forces all pulling in the same direction at once - food demand, energy markets, and Chinese trade policy, which we will cover in more detail later in this report.
Grain Buffer Setup
Stock-to-use ratios at multi-decade lows.
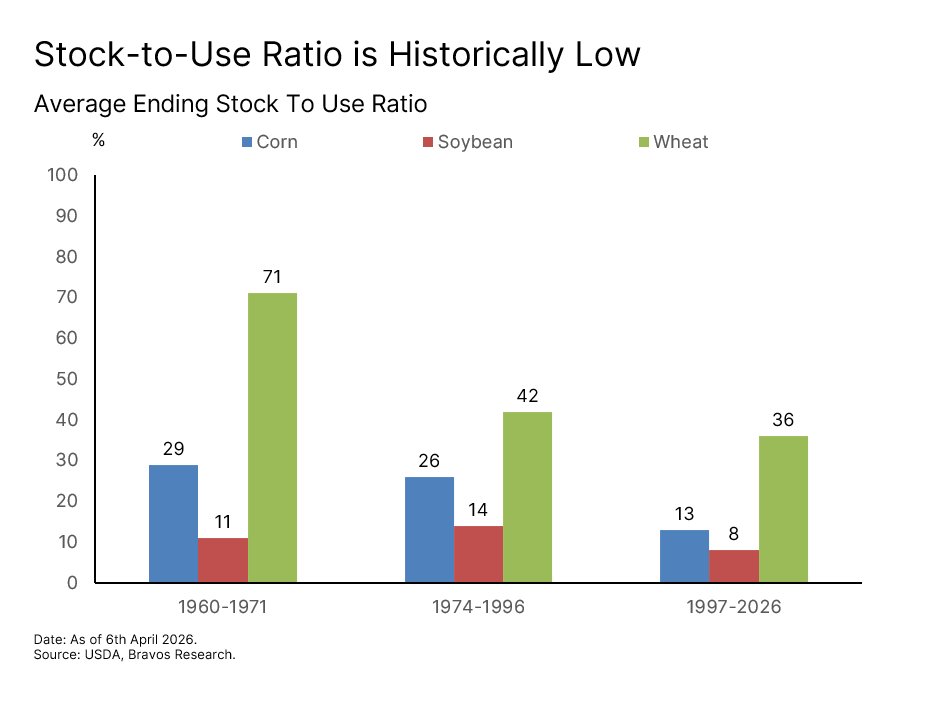
A Historically Thin Grain Buffer Has Set the Stage for a Sharp Repricing Despite everything outlined above, agricultural commodity prices have largely failed to reflect it. The main reason prices stayed low for so long was that the world had built up a comfortable cushion of grain reserves. That cushion is now gone. As of early 2026, global grain production of 2,460 million tonnes is barely keeping pace with global consumption of 2,415 million tonnes. The buffer between what the world grows and what it eats has never been thinner.
This shows up clearly in the stock-to-use ratio, which is a measure of how many months of supply are sitting in warehouses relative to annual consumption. In the US, the wheat stock-to-use ratio has fallen from 71% to 36%, corn from 29% to 13%, and soybeans from 14% to just 8%. When these numbers fall below certain thresholds, agricultural prices tend to move sharply higher. This is driven by panic buying as buyers bid against each other for limited supply and prices spike to ration what's left.
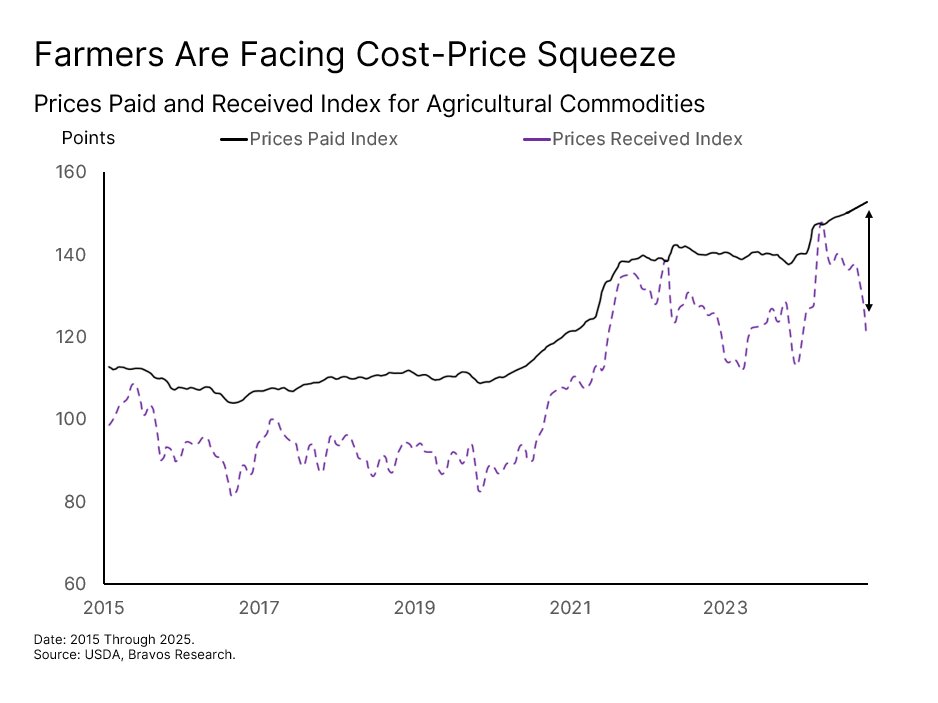
A Multi-Year Cost-Price Squeeze Could Shrink Grain Supply Further
The situation is made worse by what's happening at the farm level. Since the commodity run-up of 2021 and 2022, prices that farmers receive for their crops have fallen faster than their costs have come down. This has created one of the widest gaps in a decade between what it costs to grow food and what farmers actually get paid for it. Such a cost-price squeeze has a direct consequence for the near future.
When farmers lose money for multiple consecutive years, they eventually plant fewer acres and cut back on inputs to reduce costs. Fewer inputs on already constrained land means lower yields. As a result, supply grows even more slowly at precisely the moment when demand is accelerating.
Fertilizer Crisis
Why the fertilizer shortage cannot be quickly resolved and what it implies.
Farmers Have No Choice But to Pay the High Fertilizer Costs
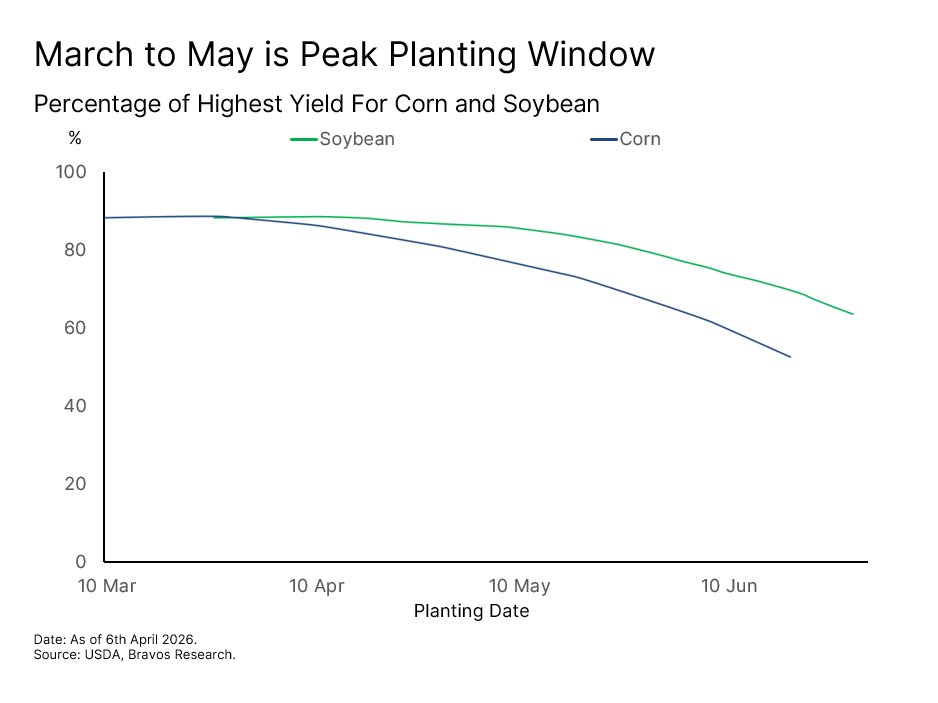
The agricultural supply-demand imbalance was already under great stress even before the recent disruption in the Strait of Hormuz. For example, fertilizer prices jumped 20.9% between 2024 and 2025, driven largely by Chinese export controls. What made the recent disruption particularly damaging is the timing. Fertilizers make up 20% to 35% of total farm operating costs. But within the narrow 60 to 90 day planting window, it is among the most price-inelastic purchases a farmer makes. The alternative to paying up is a smaller harvest, and most farmers will not accept that trade-off so close to the planting season.
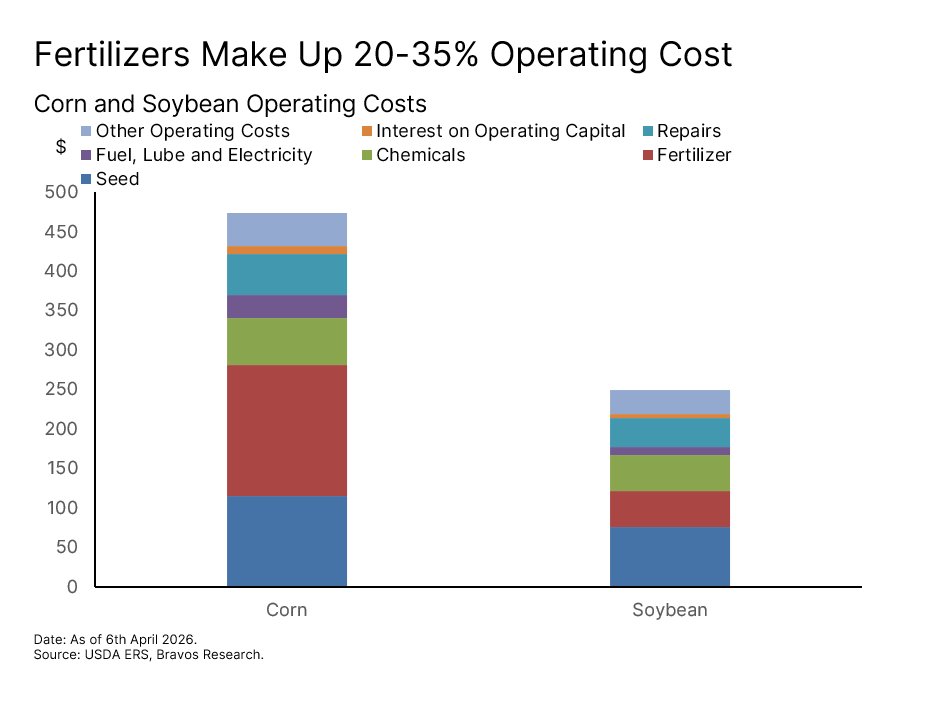
Corn and soybean planting happens between March and May, which means fertilizer purchases are being made within that window. Fertilizer costs were already expected to average $166 per acre for corn in 2026 and $57 per acre for soybeans, up 5.3% and 5.2% respectively from 2025. The Hormuz shock has significantly pushed those costs even higher and even when Hormuz re-opens, the damage has already been done as we’ll go into more detail later in this report. But first we need to understand why this fertilizer shortage cannot be quickly resolved. For that we have to look at where the fertilizer actually comes from in the first place.
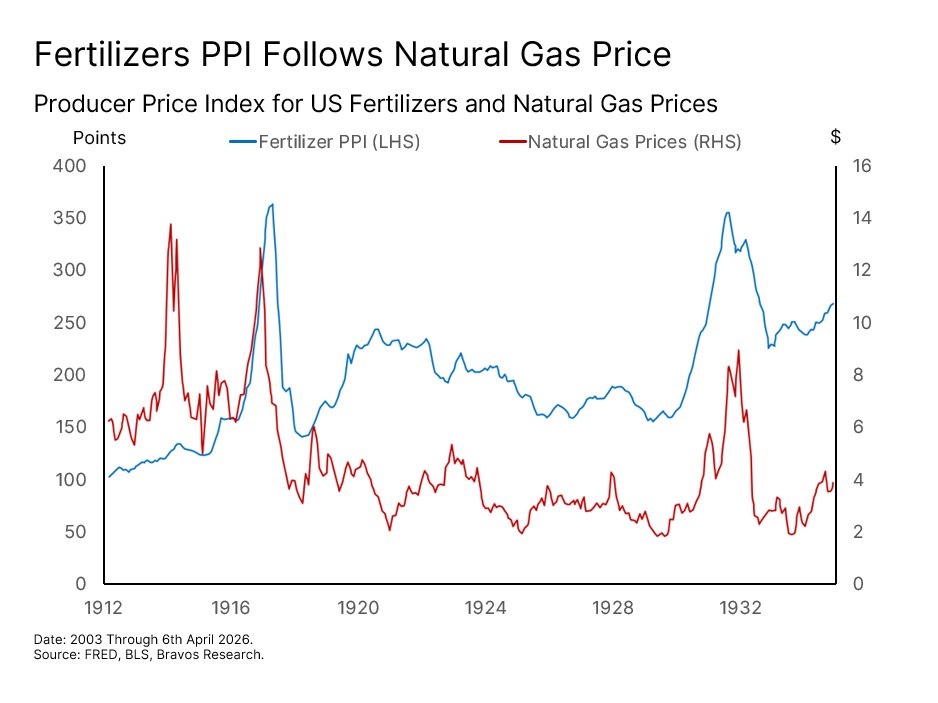
The Fertilizer Supply Chain Damage Cannot Be Quickly Resolved Natural gas accounts for approximately 80% of the variable cost of producing nitrogen fertilizer and also makes up a significant portion for other types of fertilizers. This is why the fertilizer producer price index, which tracks what manufacturers charge for fertilizer at the factory level, has historically moved closely with natural gas prices.
Gulf countries use natural gas for ammonia production, which is then processed into finished fertilizers like nitrogen-based urea. Almost 50% of global urea supply comes directly from this region, with American farmers being the single largest importers.
Irrespective of whether the Strait of Hormuz is open or closed, the war has already severely damaged gas fields in Iran and Qatar. These are home to the world's largest natural gas reserves. They were also a key supply source for fertilizer producers in countries like India, the world's second largest nitrogen fertilizer producer. Rebuilding the infrastructure and supply chain for these damaged gas fields is like going to take multiple months to years. So the damage to this planting season has already been done.
The result is an aggressive repricing of fertilizer prices. For example, urea prices have surged more than 50% to almost $700 per metric ton in just one month. This is what happens when farmers scramble to secure whatever inventory remains ahead of the planting season.
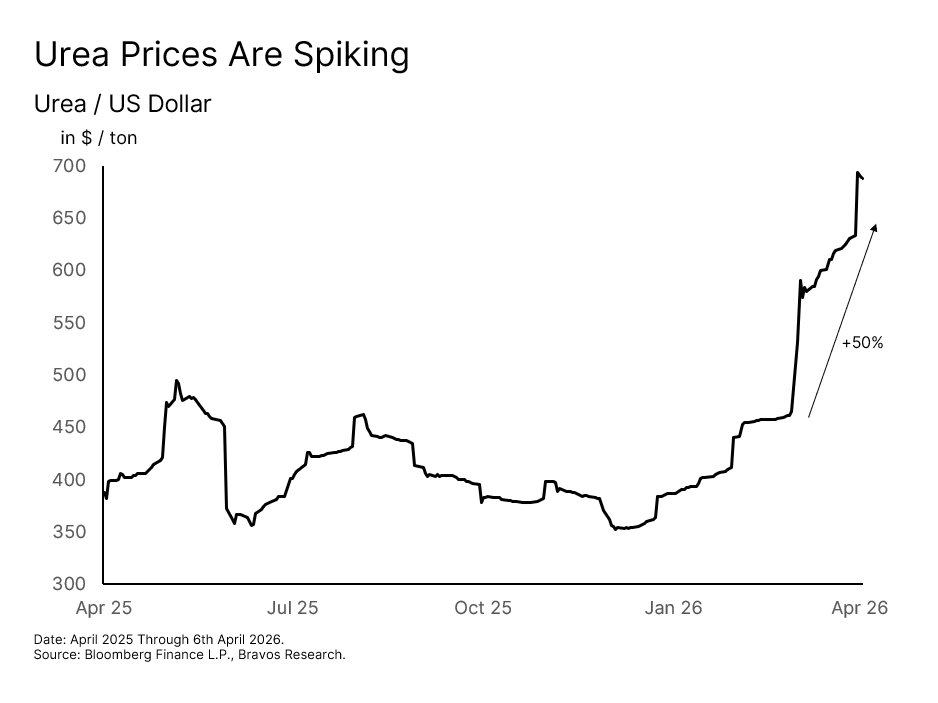
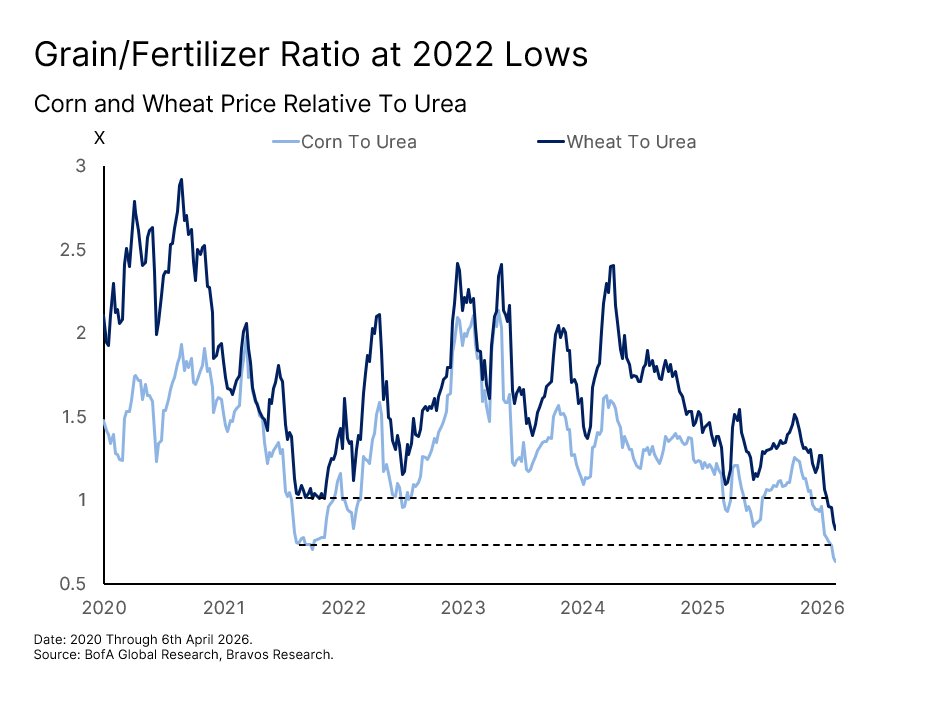
Either Fertilizer Prices Have to Fall or Grain Prices Must Rise The fertilizer repricing tells a simple but important story. The ratio of grain prices relative to fertilizer costs has collapsed back to the 2022 lows. At these levels, either fertilizer prices must fall sharply (unlikely) or grain prices will have to rise to restore the basic economics of farming. The last time this ratio fell to similar levels, grain prices subsequently doubled.
Now the path to higher grain prices runs through one of two scenarios. In the first, farmers absorb the higher input costs and pass them on through higher selling prices for their crops. In the second, farmers cut back on fertilizer usage to protect their margins, leading to lower yields and tighter supplies. This is what's known as the “yield cliff” scenario and would in turn trigger a surge in crop prices down the line. Either way, both scenarios point to the same outcome: an incoming rise in agricultural commodity prices.
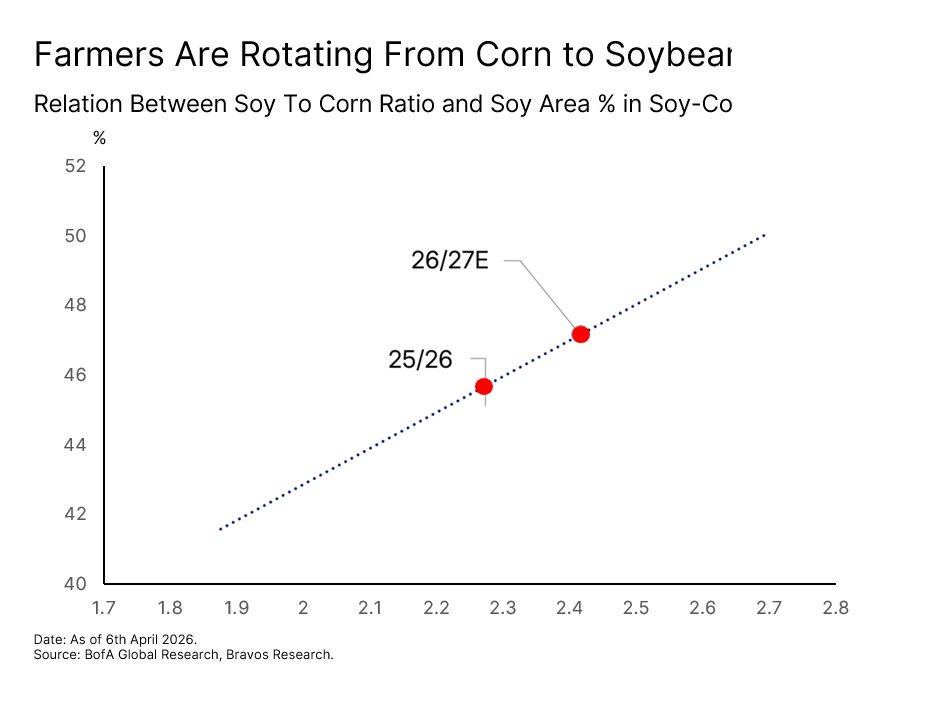
Corn is the Most Vulnerable Crop in This Environment Not every crop is equally exposed to a fertilizer shock though. The degree of exposure comes down to how much nitrogen a crop actually needs to produce a viable yield. Corn sits at the most vulnerable end of that spectrum, requiring between 100 and 240 pounds of nitrogen fertilizer per acre. Soybeans, by comparison, require very little.
So when urea prices surge, corn production costs and planting decisions are the first to get hit. US farmers were already planning to reduce corn planting from 98.8 million acres down to 95 million acres. Instead, their plan was to rotate into soybeans in response to the more favorable cost economics.
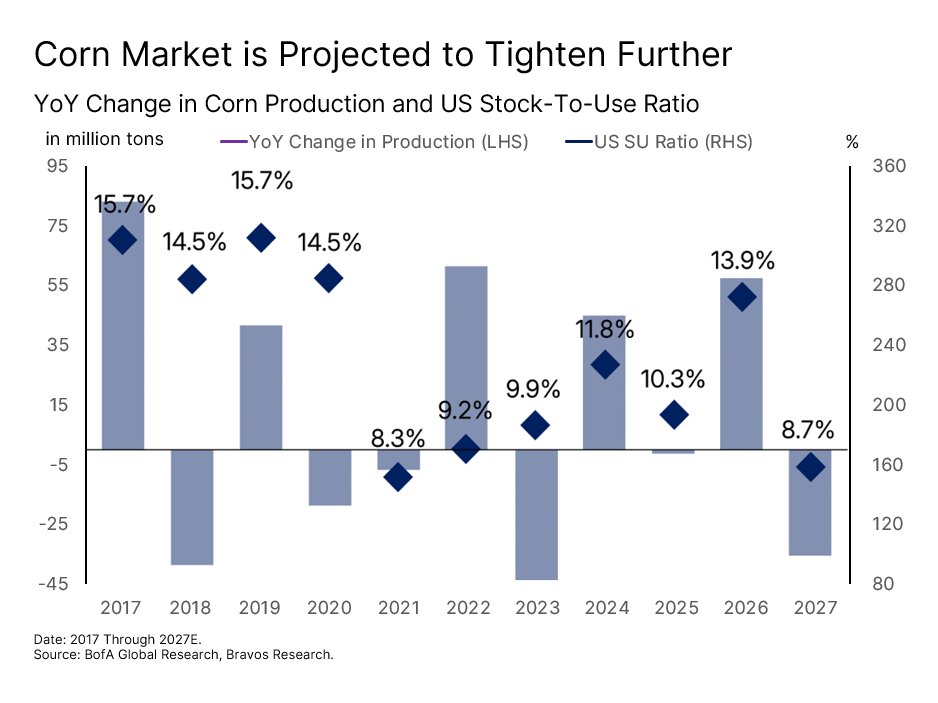
If the fertilizer shortage further reduces global corn output, the US corn stock-to-use ratio for 2026/27 could fall from 13% to just 8.7%. This would mark the second lowest level in a decade. The last time the stock-to-use ratio fell below 9% was in 2021, which was followed by over a 150% move higher for corn prices. The setup today looks remarkably similar.
At the same time, production across the four major corn-producing regions (the US, Brazil, Argentina, and Ukraine) is also expected to decline year-over-year. This combination of falling production and shrinking inventories creates one of the tightest corn balance sheets in the past decade.
Chinese Demand Could Push Soybean Inventories to a Breaking Point Soybeans face a different but equally compelling setup. As we highlighted earlier, the US soybean stock-to-use ratio already sits at just 8%. But there is an additional demand catalyst that the market has not yet fully priced in. China recently announced it would purchase 20 million tons of US soybeans for the 2025/2026 season, with commitments of 25 million tons annually for the following three years. If those purchases materialize, the US soybean stock-to-use ratio could fall toward 5% even with the additional acreage coming online. Such a low level could trigger a sharp price spike for soybeans.
Today's Setup Mirrors the 1970s But Structural Pressures are Even Stronger To understand the full magnitude of what could be coming, it helps to look back at the last time these many forces converged on agricultural markets all at once. In the early 1970s, wheat, corn, and soybean prices began rising rapidly. By 1974, they had reached record highs after a series of simultaneous shocks: 1) The 1973 Arab oil embargo 2) Several years of adverse weather across major producing countries
3) Large Soviet Union grain purchases 4) Collapse of the Peruvian anchovy catch leading to a spike in demand for soybean meal as a protein substitute 5) Significant underinvestment in agricultural commodities
It was the combination of these factors that made the 1970s commodity cycle so powerful. Today's setup rhymes closely with that period. We have an energy shock, a fertilizer supply decline, growing weather risk from El Niño in the second half of 2026, and a geopolitical reordering of trade flows through tariffs. All of these are hitting at the same time.
In 1973-1974, grain prices surged 2 to 3 times from their pre-shock lows. Today, the structural backdrop is significantly more demanding than it was back then. Livestock feed demand is larger, biofuel mandates have created an entirely new source of agricultural demand, and the land and water constraints we have outlined simply did not exist at this scale in the 1970s.
History offers one more telling data point that we think is important. In the past 60 years, there have only been four periods where prices of at least two of the three principal field crops surged for two or more consecutive years: 1973-74, 1994-95, 2006-08, and 2010-12. Every single one was preceded by the same combination of an energy shock, a supply disruption, and tight inventories. Those are precisely the conditions present today.
Institutional Investors are Just Starting to Pile In What makes today’s setup even more interesting is how institutional capital was positioned heading into all of this. Throughout the last few years, institutional money was running one of the largest net short positions in agricultural commodities. In other words, professional investors were overwhelmingly betting against the very thesis we have outlined above.
That positioning has now begun to shift. Since the beginning of this year, their net position has flipped to approximately 250,000 net long contracts. But to put that in context, the peak net long position reached 1,100,000 contracts in 2011 and 800,000 contracts in 2022. Both of these periods saw significant agricultural commodity price appreciation.
Today's net long position is still a fraction of either of those levels. If institutional positioning simply reverts toward average historical levels, it implies hundreds of thousands of additional contracts of buying pressure still to come across the agricultural space. This would be on top of the fundamental supply and demand forces
Crop Price Targets
Price targets for soybeans, wheat, and corn.
that are already in motion. So what does all of this actually mean for agricultural commodity prices?

Our Price Targets for the Three Principal Crops
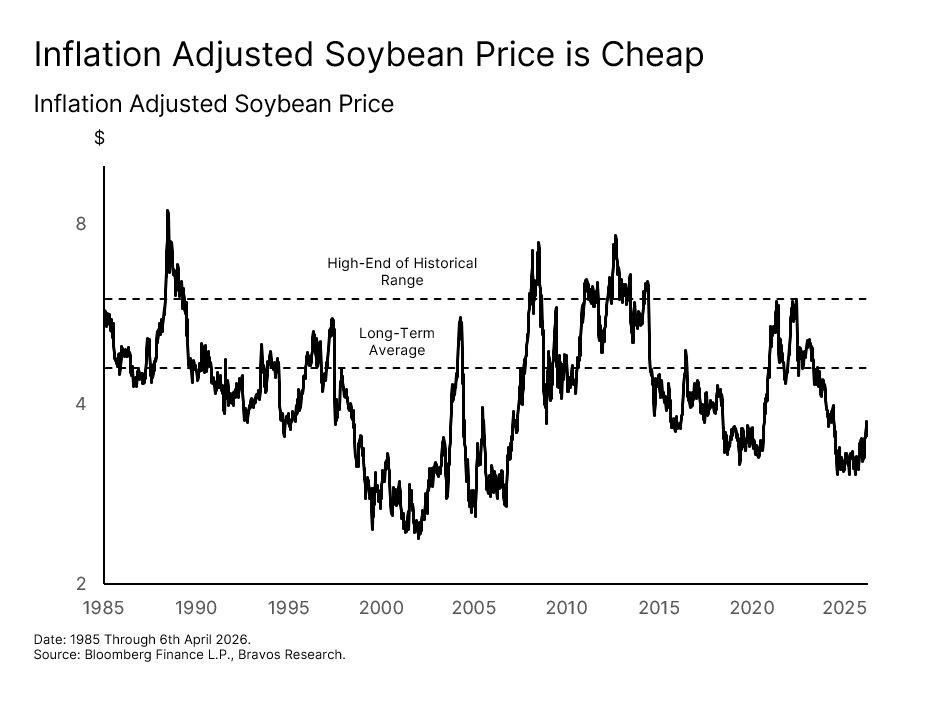
Soybeans are currently trading around $11.65 per bushel. In inflation-adjusted terms, that places them near the bottom of its four-decade historical range. A simple mean reversion to the long-term real average would represent a 30% gain from here, equating to around $15 per bushel in today's dollars. If real prices were to move toward the upper end of the historical range, then that would mean a 70% gain, putting soybeans at almost $20 per bushel. These are our conservative estimates though because if inflation continues to rise from here, the nominal targets would naturally move higher alongside it.
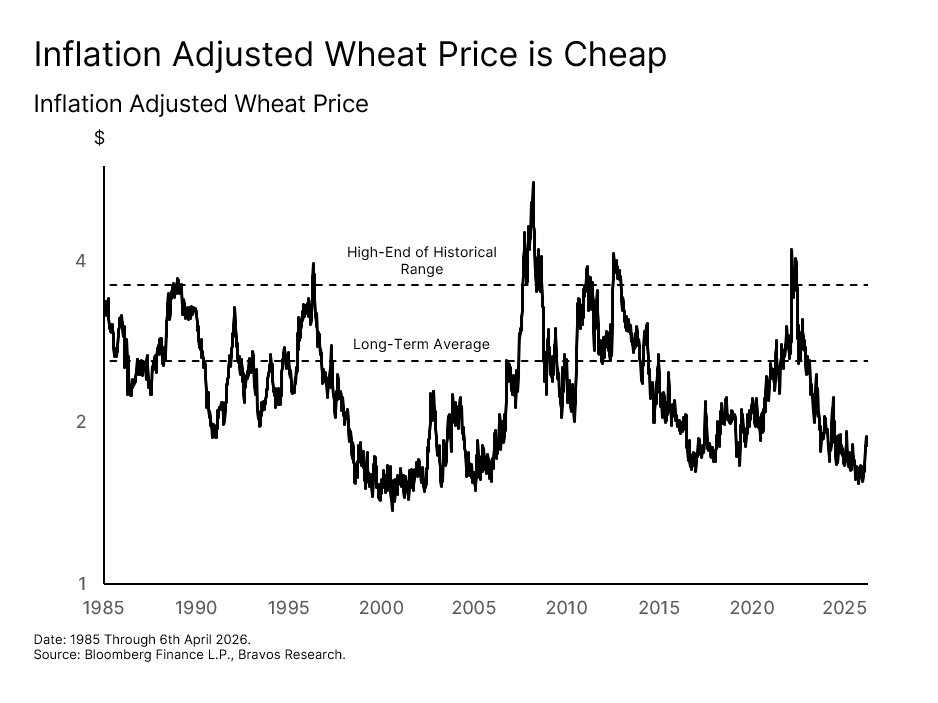
Wheat is currently trading around $6 per bushel, with its inflation-adjusted price at the lower end of its historical range. A move back to the long-term average implies 50% upside and would equate to around $9 per bushel in nominal terms. Whereas a move toward the historical upper range would put wheat at around $12 per bushel, representing a 100% gain. As with soybeans, these targets assume inflation stays roughly where it is today. Any further rise would push the nominal targets even higher.
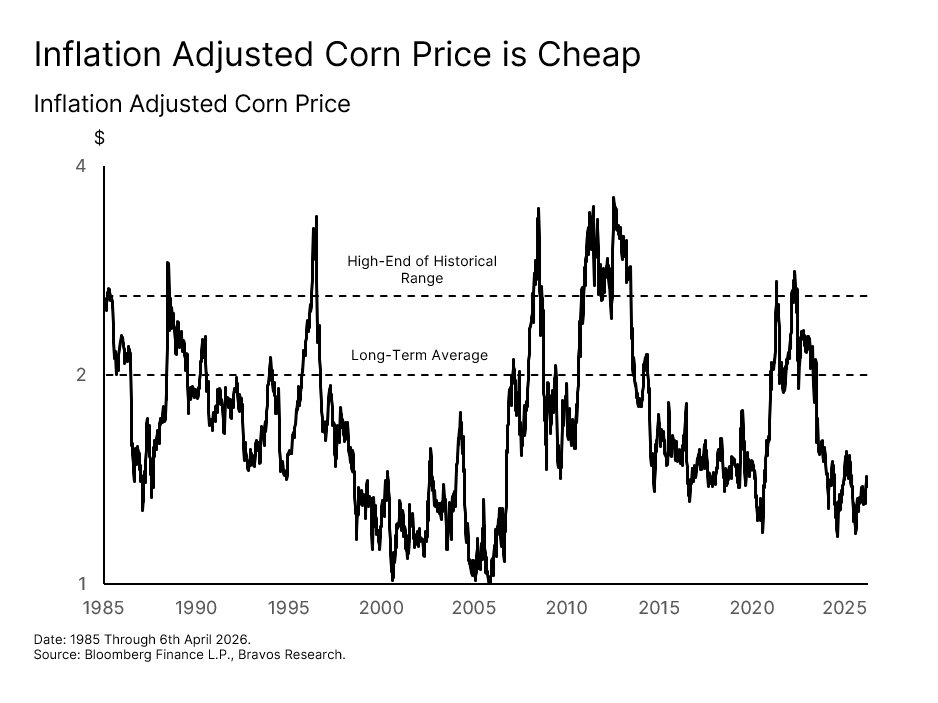
Corn tells a similar story. On an inflation-adjusted basis, it is sitting well below its long-term average. Getting back to that average is a 50% move up from here, putting corn at around $6.75 per bushel in today's dollars. The upper end of its historical real range implies a 105% gain to around $9.20 per bushel. Given the degree of nitrogen dependence, the acreage rotation, and the stock-to-use dynamics outlined in this report, the fundamental case for corn reaching that upper range is arguably the strongest of the three crops.
ETF Plays: DBA & VEGI
Two ETFs offering broad agricultural exposure.
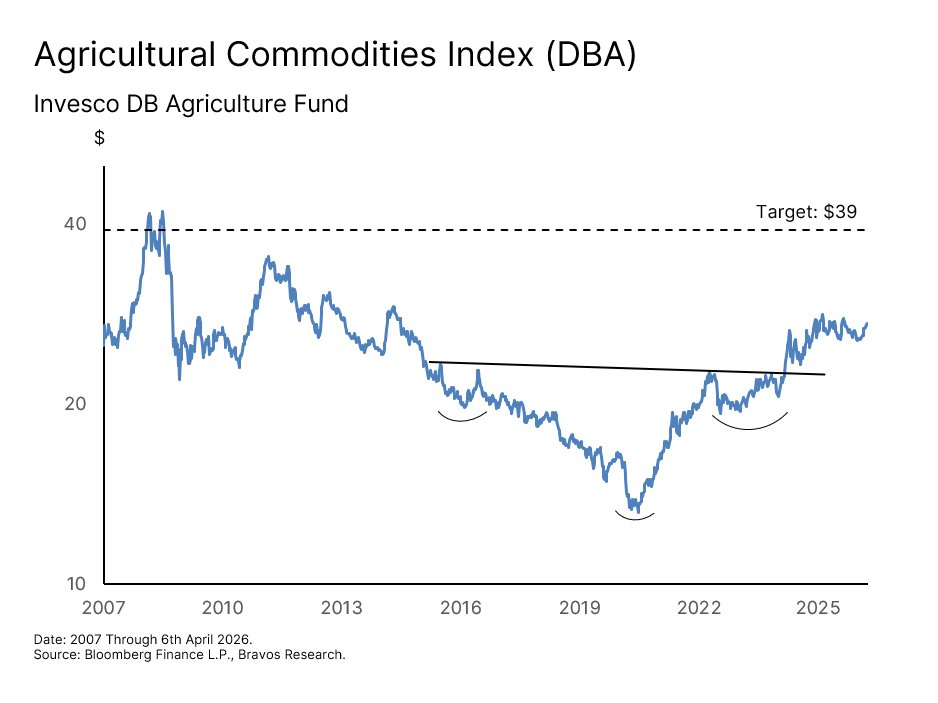
Two ETFs Offer Broad Agricultural Exposure A broad way to invest in the agricultural space is through the Invesco DB Agriculture Fund (DBA). It tracks a basket of agricultural commodity futures including wheat, corn, soybeans, sugar, cattle, and coffee. This provides direct exposure to agricultural commodity price movements without the need to trade individual futures contracts.
After a decade of declining prices, DBA broke out of an inverse head and shoulders basing pattern in 2025. Since then it has been consolidating, essentially digesting that initial move. We think the current macro environment should provide the fuel needed for DBA to finally break out of this consolidation and make its next leg higher. The implied upside target from the basing pattern is approximately $39, representing around a 45% gain from current levels.
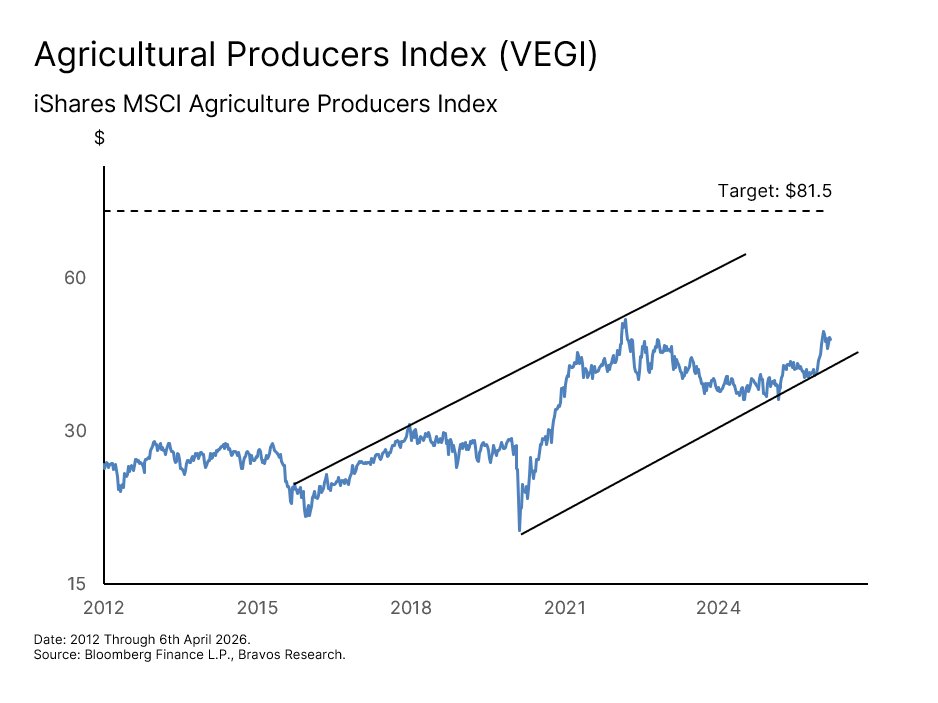
For investors who prefer to have exposure to the agricultural theme through the companies that directly benefit from it rather than the commodities themselves, the iShares MSCI Agriculture Producers ETF (VEGI) is our preferred vehicle. It tracks a global index of companies across the entire agricultural supply chain. This includes fertilizer producers, agricultural chemical companies, farm machinery manufacturers, and packaged food and meat businesses.
As agricultural commodity prices rise, these are the businesses that tend to see their revenues and margins expand as a direct result. This gives VEGI the potential to deliver leveraged exposure to the agricultural thesis relative to the underlying commodities themselves. VEGI has been in a well-defined rising channel since 2016. It recently bounced off channel support, which is a constructive sign that the longer-term uptrend remains intact. The channel resistance sits approximately 80% above current levels, giving us a target of around $81.50.
Now there are also 6 specific companies within this sector that we find particularly attractive. These are companies that we think are ideally positioned to take advantage of this environment and have the potential for significantly more upside than the ETF itself.
Nutrien (NTR)
The cheapest producer in an inelastic market.
Stock 1: Nutrien Ltd. (NTR) When crop prices rise, the entire agricultural supply chain gets a tailwind. But not every company in that chain benefits equally. Some have structural advantages that turn an agricultural commodity upcycle into a disproportionate earnings event. We believe Nutrien is one of those companies.
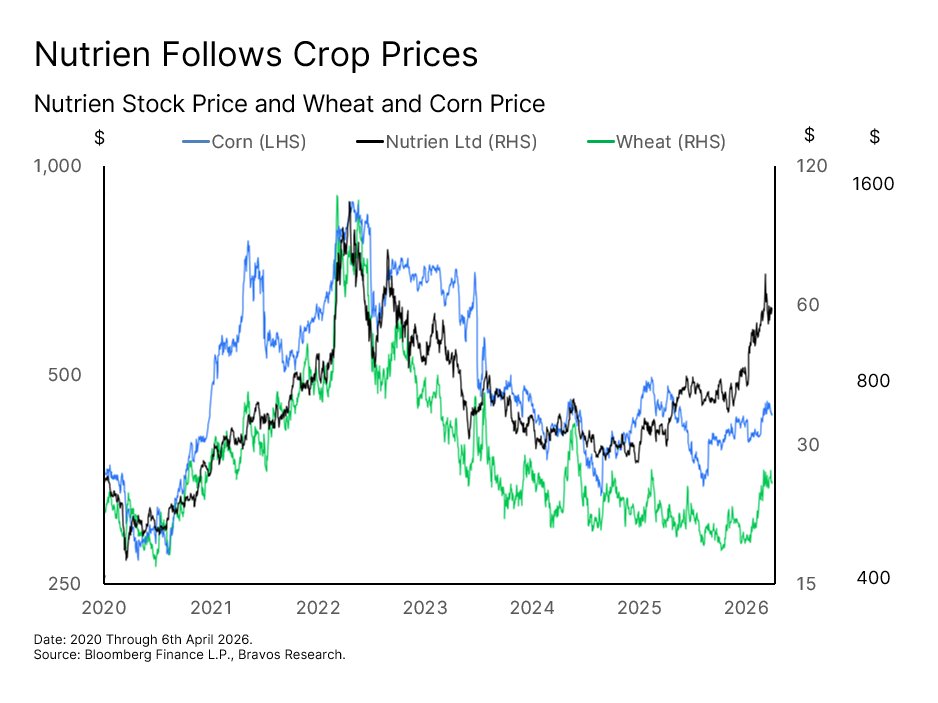
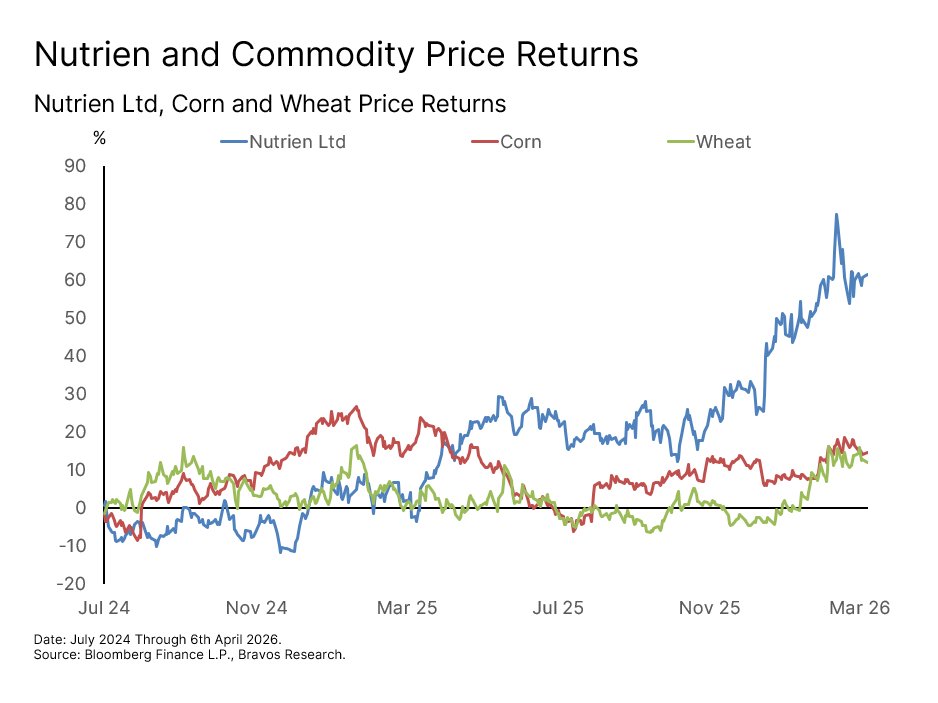
As we highlighted earlier in this report, fertilizers make up 20 to 35% of total crop costs but have an outsized impact on crop yield. This is what makes fertilizer demand highly inelastic, especially around the planting window. When crop prices rise, that relationship is put on steroids. Farmers who are already committed to buying fertilizer regardless of price now have an even stronger incentive to maximize every acre's output. The economics of applying more inputs improve dramatically when the crop they are growing is worth significantly more. Nutrien sits at the center of that dynamic. We can see this by looking at the close relationship between NTR against the price of corn and wheat, for example.
Lower Costs & Greater Scale Gives Nutrien an Outsized Advantage
Nutrien is the world's largest fertilizer producer by capacity, controlling approximately 20% of global potash supply. But what makes Nutrien particularly compelling in this environment is not just its size. It is the combination of cost advantage and scale.
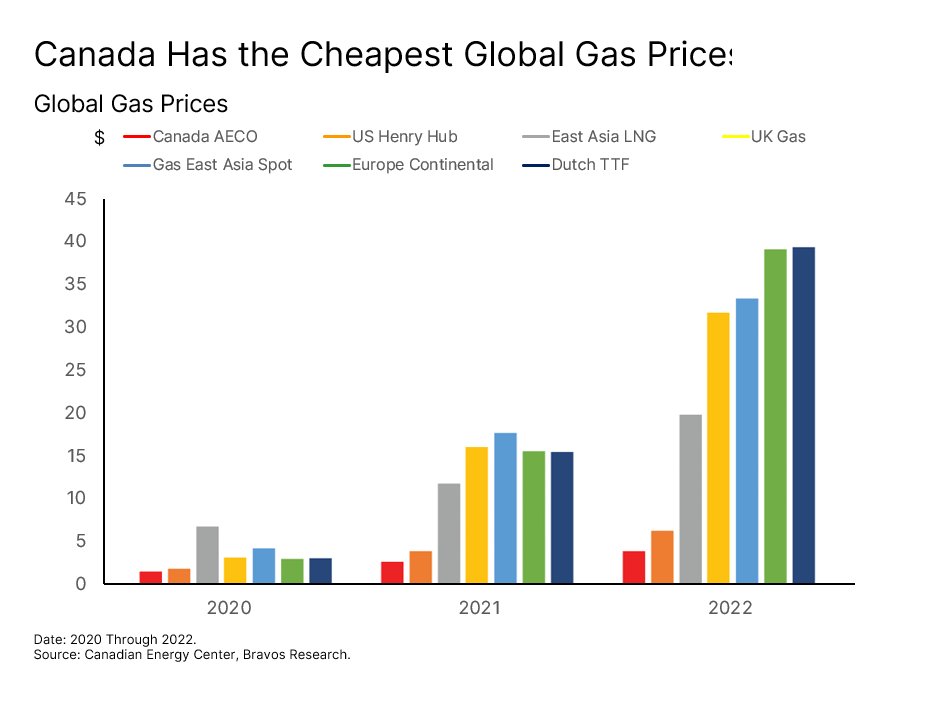
By concentrating its nitrogen-based fertilizer production in Western Canada, Nutrien accesses some of the lowest-cost natural gas feedstock available globally. As energy-driven inflation pushes fertilizer production costs higher for competitors around the world, Nutrien is largely insulated from this.
As a result, Nutrien is able to produce fertilizers at a lower cost while selling into a globally elevated price environment. Every $25 per tonne increase in nitrogen-based fertilizer prices directly translates into approximately $250 million in additional earnings for the company. With urea prices already up more than 50% since March 2026, it acts as a significant tailwind for Nutrien.
This cost advantage is further amplified through Nutrien's potash quality. Its deposits are among the highest grade in the world, nearly double the grade of the world's second-largest potash reserve. Higher grade means lower cost per tonne to mine and process. So Nutrien can be much more price-competitive than peers while still maintaining superior margins.
Nutrien's scale gives it another advantage that goes beyond cost. Unlike smaller producers that are constrained by capacity, Nutrien can ramp up production to meet rising demand quite quickly whenever the economics make sense. So when fertilizer demand accelerates, Nutrien doesn't face the bottleneck problem that limits other competitors. This is what makes Nutrien genuinely an exceptional bet in this type of environment.
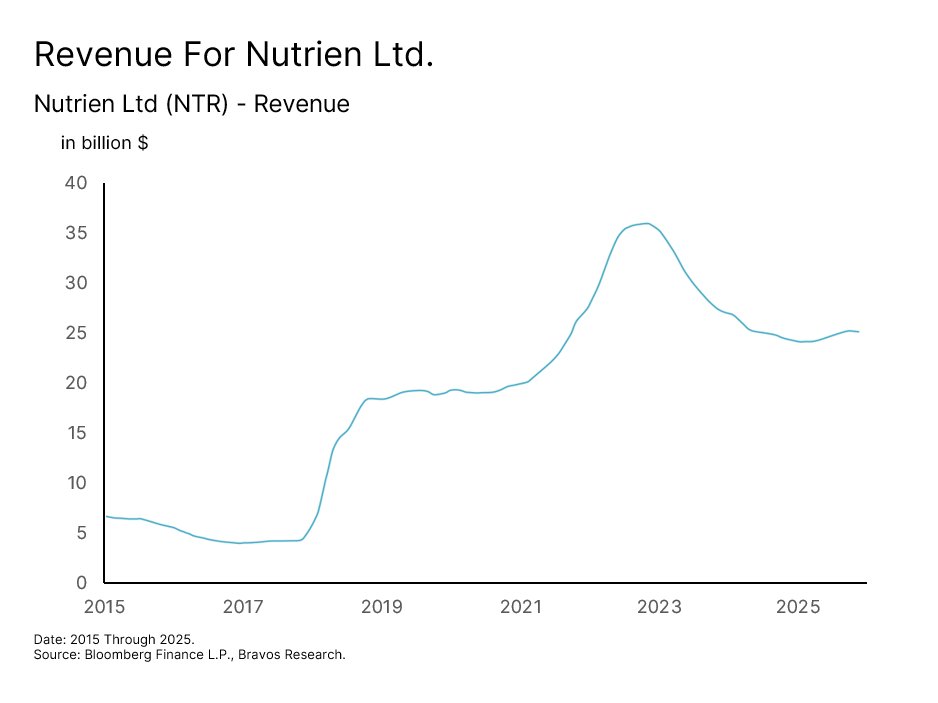
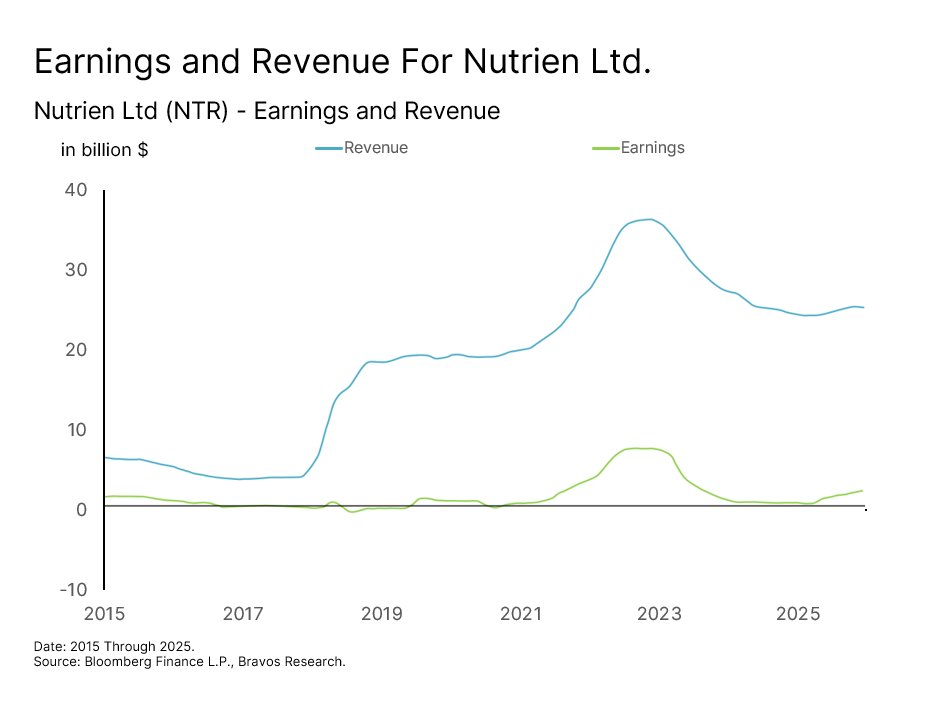
This dominant position has allowed Nutrien to consistently grow its revenues cycle after cycle in a stair step fashion. The last two times crop prices rose were in 2018 and 2022. In both instances, Nutrien was able to expand its revenues significantly. Since 2022, the company has still been able to relatively stabilize its revenues around $26 billion despite a “dead” agricultural commodity market. A pick back up in crop prices would likely lead revenues to take its next step higher and exceed the 2022 highs of $37.9 billion.
When Revenue Surges, Margins Significantly Expand What makes this potential revenue growth particularly attractive for us is its impact on Nutrien's earnings. You see, fertilizer production is a high fixed-cost business. The mines, plants, and infrastructure cost roughly the same to run whether Nutrien is producing at 50% capacity or 100%. So when revenue rises, those fixed costs don't move much. That means the incremental revenue flows almost directly to the bottom line.
For example, when Nutrien’s revenue surged between 2020 and 2022, net profit margins expanded from below 10% to over 20%. As a result, the company saw a big ramp up in its earnings profile. Today, Nutrien’s net profit margins sit at 8.7%. This gives the company ample room to see both its revenues and earnings rise materially as crop prices recover.
When revenues surge and margins expand simultaneously, Nutrien generates an enormous amount of free cash flow. What makes this even more attractive is what Nutrien does with that cash. The company has a strong track record of returning that capital to its shareholders through buybacks and dividends. Nutrien recently authorized a new 5% share buyback program, building on the 2% of shares it already retired in 2025. Combined with its 2.9% dividend yield, the company offers nearly a 4.5% total shareholder yield.
This is something that’s already beginning to show up in Nutrien’s stock price. NTR has risen approximately 50% over the past few months, even as crop prices have only moved up by around 15%. As crop prices continue to rise and the earnings expansion materializes, we think that outperformance is likely to continue.
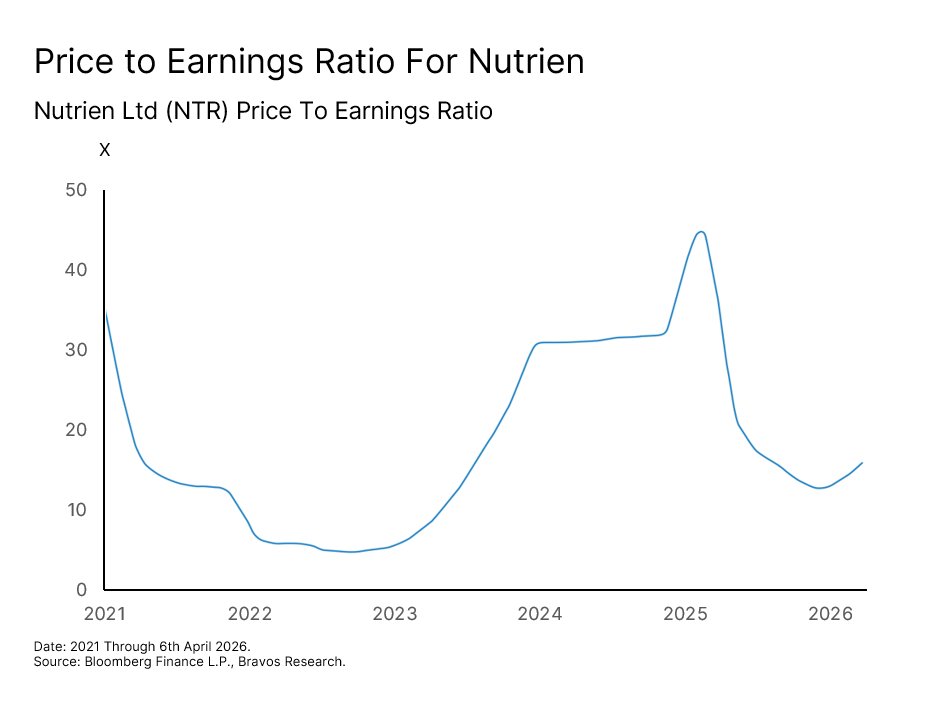
The Market Has Not Yet Priced In Nutrien’s Earnings Power The valuation picture adds another compelling layer to this story. NTR currently trades at a PE ratio of 16x, which is well below its own 10-year median of 25x. In fact, NTR had reached a PE ratio of almost 36x in 2021 at the heart of the rally in crop prices.
This tells us pretty much none of the unique differentiators for the company in this environment have been priced in yet. So not only do the revenues and earnings have the potential to move significantly higher, but also the valuation of the company as money starts to get allocated in the space.
If Nutrien’s revenue recovers toward the 2022 peak of $37.9 billion and net margins re-expand toward 20%, net income would reach approximately $7.6 billion. Nutrien also has fewer shares outstanding today than it did in 2022. Thanks to consistent buybacks, the share count has fallen from 540 million in 2022 to 481 million today. That would translate into an earnings per share of around $15.75.
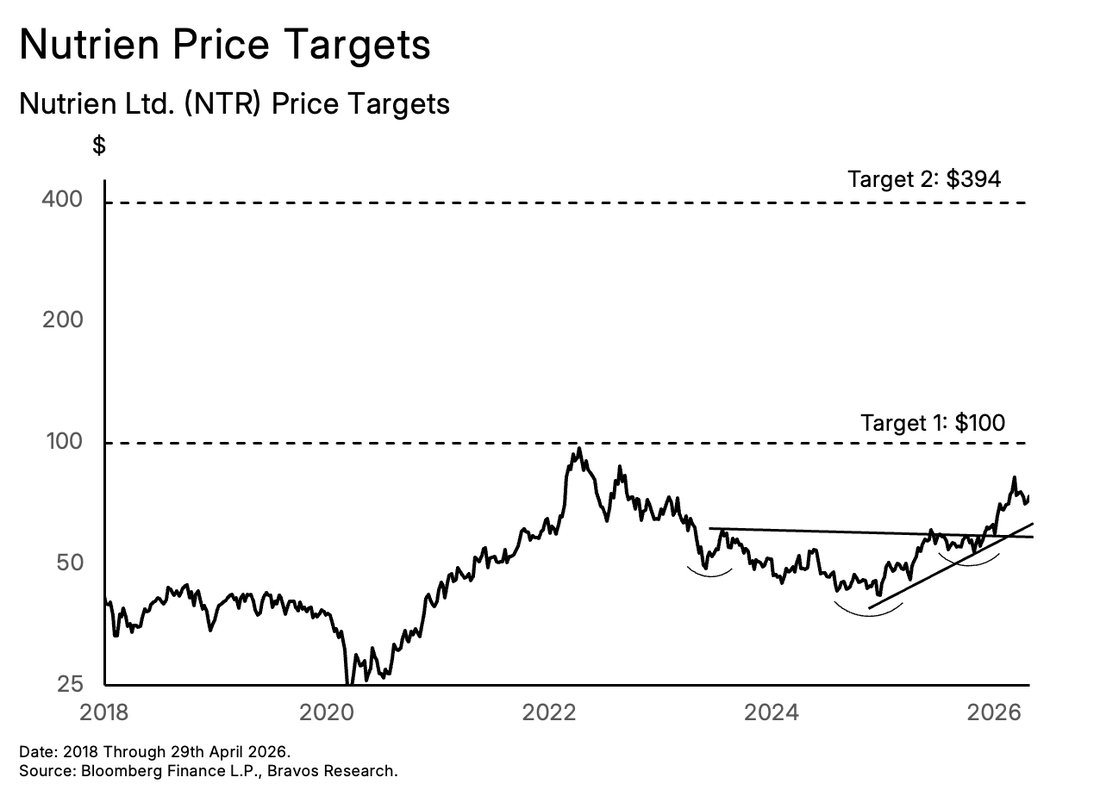
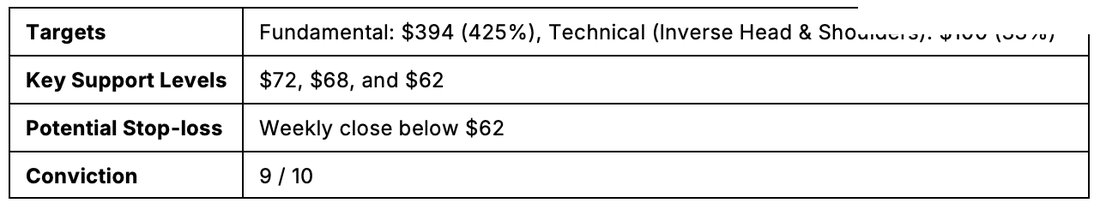
As the market begins to properly price in Nutrien’s earnings power in this environment, a re-rating back to NTR's 10-year median PE of 25x looks very reasonable. This would translate into a share price of $394, representing 425% upside from current levels. None of this requires anything unprecedented though. It simply requires a repeat of what this company has already demonstrated it can deliver when crop prices are rising.
In the medium-term, NTR has broken out from a multi-year inverse head and shoulders basing pattern. The implied target for this pattern is $100, which would be a 33% move from current levels.
Our conviction for this stock remains high, with a rating of 9 out of 10. But while the overall upside potential for this stock is significant, our near-term risk management is focused around the $72 and $68 support levels. But the real line in the sand for us is $62. This is where the
primary breakout line meets the stock’s uptrend line. A weekly close below $62 would invalidate the bullish structure and force us to re-evaluate the thesis from a technical analysis standpoint.

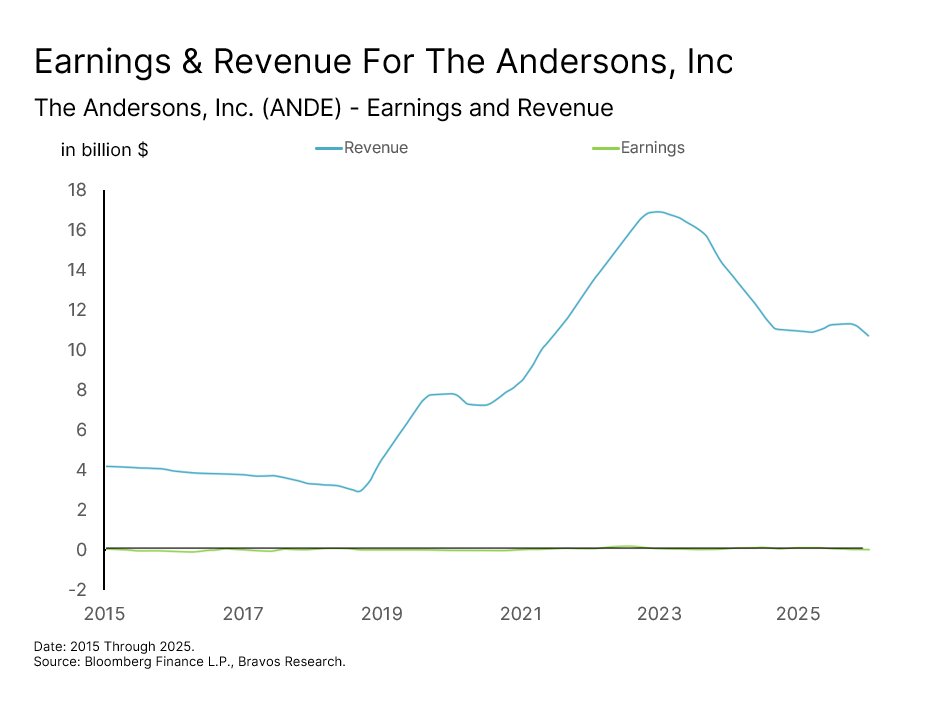
Stock 2: The Andersons, Inc. (ANDE) The Andersons' primary business model has been commodity trading. The company buys grains from farmers and sells them to exporters, ethanol plants, and food processors. Like most commodity traders, ANDE earns thin margins on high volumes. So when grain prices rise, the value of grains flowing through the business rises with them, directly increasing revenues and earnings.
We saw this between 2018 and 2022, for example, when revenues grew from $3 billion to nearly $17 billion as agricultural commodity prices surged. But the cooling of the agricultural sector since then has pulled revenues back down. With grain prices now recovering, the argument for revenues growing back above the 2022 highs is becoming increasingly
The Andersons (ANDE)
Infrastructure scarcity meets ethanol ownership.
credible. And this is before accounting for the changes the company has recently made to its business model.
Full Ethanol Ownership Creates a Second and More Powerful Earnings Driver
The second tailwind is arguably more compelling. ANDE recently acquired full ownership of four ethanol plants with a combined annual production capacity of approximately 500 million gallons, roughly 3% of total US output. What makes this particularly powerful is the integration with the core business. Rather than buying grains from farmers and selling them to third-party ethanol producers, ANDE can now take those same grains and produce ethanol itself. This has the potential to significantly expand the company’s profit margins that have historically operated below 1%.
When corn prices rise, ethanol prices tend to follow. Full ownership means all of those profits now flow entirely to shareholders instead of being shared with joint venture partners like in the past.
Full ownership also unlocks a direct financial benefit that did not previously apply. The 45Z tax credit rewards companies for the low-carbon intensity of their biofuel operations. All four of ANDE's plants qualify for this. In 2025, the 45Z credit generated $35 million for the company. But that only reflected a partial year of full ownership since the acquisition was completed later in the year. In 2026, that same credit is expected to generate $90 to $100 million. That is a near-tripling of a single tax benefit that flows directly to the bottom line, with no additional capital required.
The ethanol plants are not the only renewables exposure for ANDE. In H1 2026, the company is launching a bio-based diesel feedstock storage and blending facility in Kansas. This facility targets feedstocks for Sustainable Aviation Fuel (SAF) and renewable diesel. Both of these products have a significant premium over conventional ethanol. As airlines face mounting regulatory pressure to source SAF, ANDE is expanding into this market that did not exist for the company 12 months ago.
The Port of Houston Adds a Third Layer of Revenue
On top of this double tailwind, ANDE owns the grain elevator at the Port of Houston that it began operating in late 2024. Most grain companies are forced to rely on third-party
infrastructure, paying fees and navigating congestion to get their product to export markets. The Andersons owns the exit point. That is a competitive advantage that most peers cannot really replicate quickly. And the strategic value of this infrastructure asset is about to expand even further.
In Q2 2026, a major expansion will add the capability to export soybean meal alongside grain and sorghum. Soybean meal is a higher-margin product that should help boost ANDE’s earnings. This also turns the Houston elevator into a multi-commodity hub at a moment when global soybean meal demand is projected to grow 14% through 2030.
A Lean Balance Sheet Behind a Margin Expansion Story
The above three catalysts are converging at the same time. We already know that ANDE's margins have historically sat below 1%, but that was a reflection of the old commodity trading model. As the ethanol integration and infrastructure expansion become a larger share of revenue, those margins have room to double or even triple from this low base.
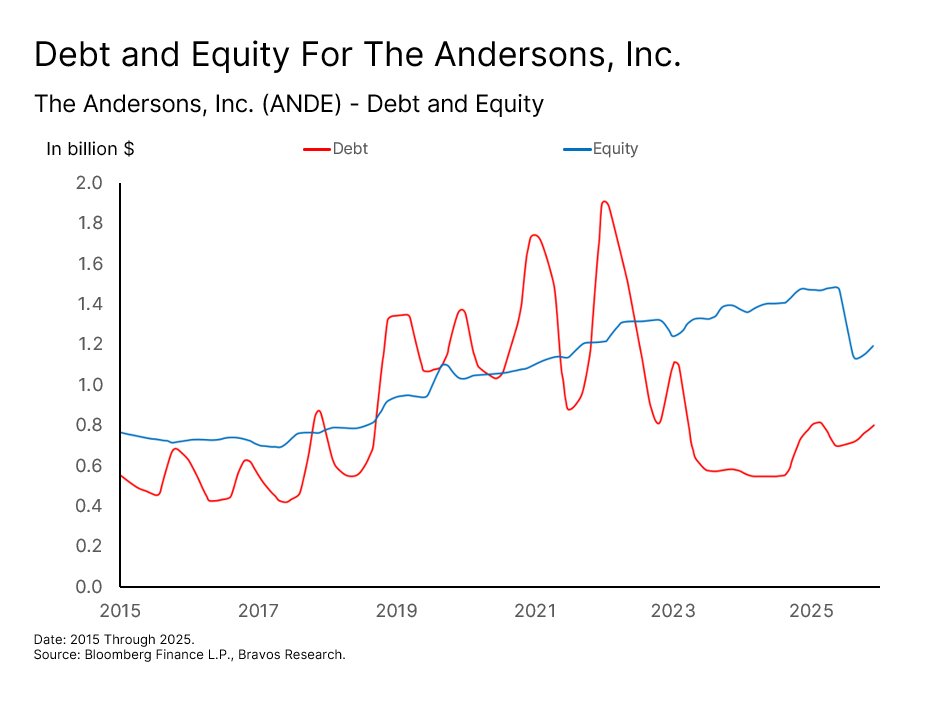
For a company undergoing this kind of transformation, the one risk that could undermine its growth potential would be excessive debt. But ANDE has spent the last several years aggressively cleaning up its balance sheet. The company has brought its debt-to-equity ratio down to 67% from a 2022 peak of 158%. At 67%, ANDE is in significantly better shape than industry peers where ratios of 100% to 150% are common. This gives the company the financial flexibility to accumulate grain positions, fund its capital projects, and absorb any short-term volatility that more leveraged competitors cannot.
The company’s infrastructure expansion and financial strength is also beginning to show up in its stock price. ANDE had been consolidating between 2022 and 2025 following a 400% run-up during the 2020 to 2022 commodities bull market. But the stock found its footing and started gaining momentum again at precisely the moment the company announced full ownership of its ethanol plants. As the earnings from those plants materialize this year, and the Houston and Kansas expansions also come online, we think the stock has significant runway ahead.
The Valuation Does Not Yet Reflect the New Business Model
ANDE currently has a forward PE ratio of 15.3x. This is meaningfully cheaper compared to its peers that trade at an average forward PE of 24.7x. All of the catalysts outlined above are expected to contribute to a significant earnings ramp over the next two to three years. Management has also publicly committed to growing EPS by at least 150% by 2028, driven by the Houston infrastructure expansion, full ethanol ownership, and the Kansas feedstock facility.
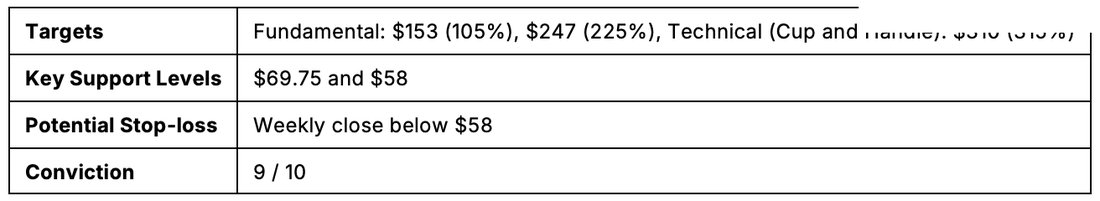
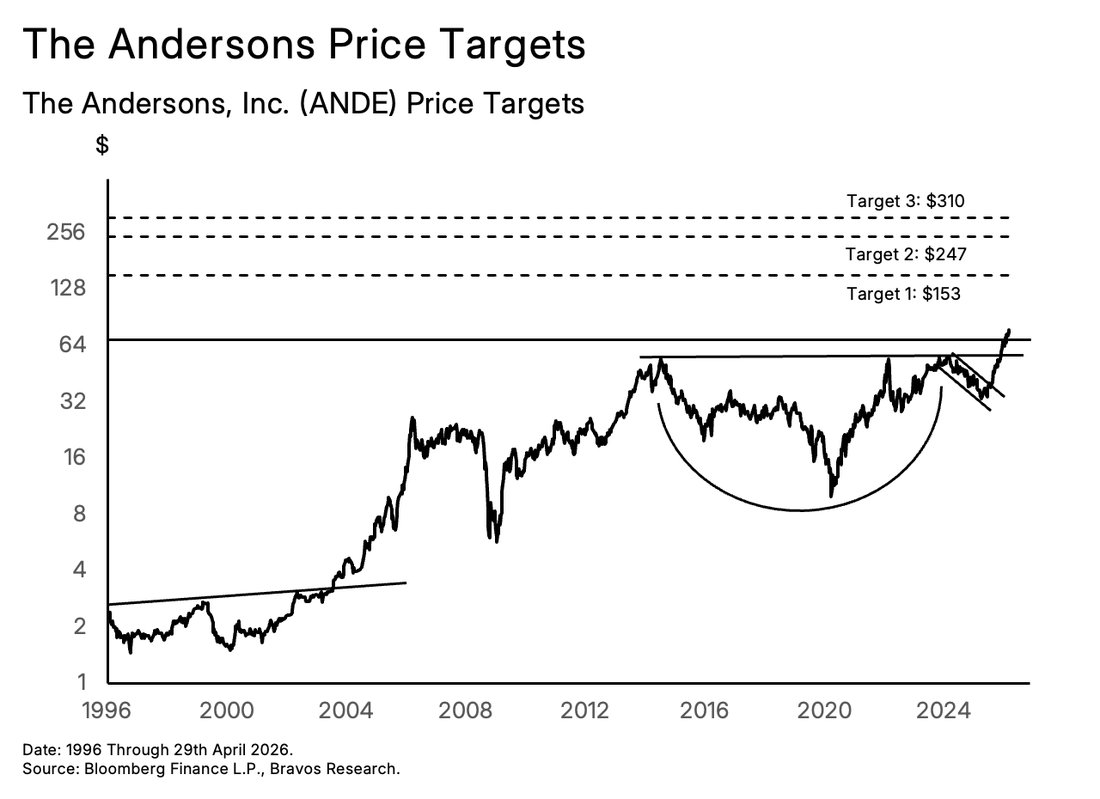
If ANDE's revenue recovers to just the 2022 highs of $17 billion and margins expand from 1% to 2% because of the new business model, the company would generate $340 million in earnings. That translates into an earnings per share of $10. Even without any change in its forward PE ratio, that earnings power alone implies a share price of approximately $153, representing 105% upside from current levels.
On the other hand, if the market begins to simultaneously re-rate ANDE closer to its peer average of 24.7x, the implied share price rises to approximately $247. That would be a 225% move up in the stock price. Given the business context, our overall conviction on ANDE stands at 9 out of 10.
The stock’s technical chart further supports its constructive macro and fundamental backdrop. ANDE has recently broken out from a 10-year cup and handle basing pattern. This structure carries an implied technical target of $310, equating to 315% upside from here. Now such a move might seem aggressive at first. But for a company with a $2.5 billion market cap trading at just 0.2x sales against a peer average of 0.8x, this type of a re-rating is fundamentally justifiable.
In fact, we saw a similar type of aggressive move in 2002. Back then, the stock broke out of a 6-year long resistance heading into an agricultural commodity cycle. This led to a 1,000% rally in the 4 years that followed. Two key support levels we’re watching are $69.75 and $58. A weekly close below $58 would be our invalidation for the current breakout. Given how quickly ANDE’s fundamentals are evolving and its price can move, this is a name that will require close monitoring and risk management.
Stock 3: Archer-Daniels-Midland (ADM) While Nutrien and The Andersons are both growth stories, Archer-Daniels-Midland represents a different kind of opportunity. This is a recovery story. ADM sits at the intersection of nearly every major agricultural flow. It processes corn, soybeans, and wheat at industrial scale, trades agricultural commodities across more than 200 countries, and supplies the ingredients, flavors, and nutritional components that go into food and beverage products worldwide.
Archer-Daniels-Midland (ADM)
A high-beta bet on agricultural prices.
So the price of the crops we have outlined throughout this report has a direct influence on ADM's earnings. This is something we can see clearly through the close relationship between ADM's stock and the price of wheat, corn, and soybeans.
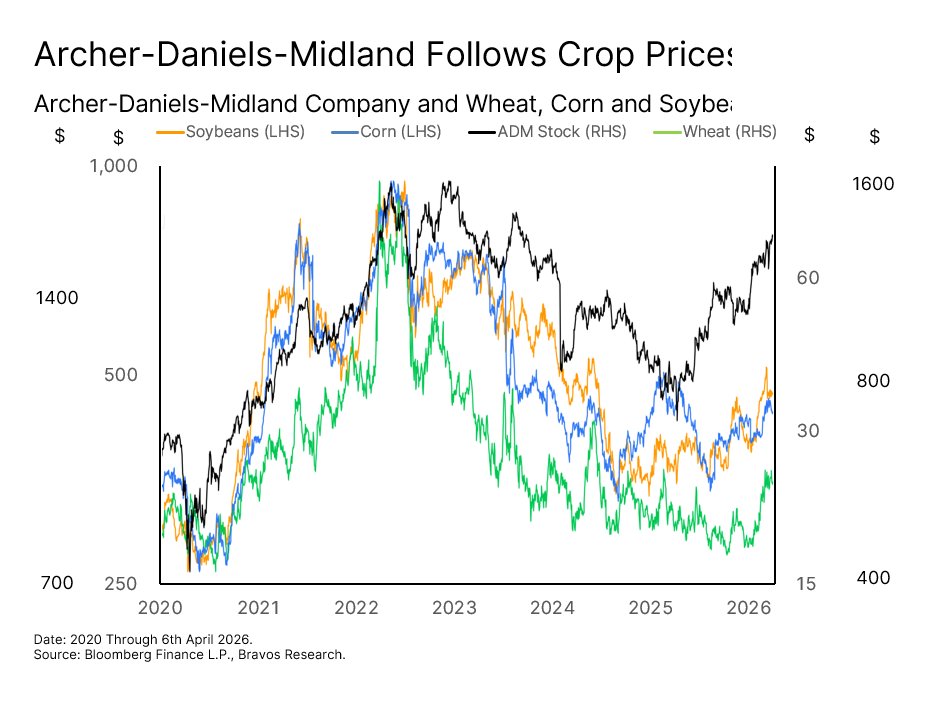
In the past few years, that relationship has actually worked against the company. A collapse in soybean crush margins had been putting pressure on their earnings. This represents the margin earned from processing soybeans to produce soybean oil and soybean meal. As highlighted earlier in this report, soybean oil has become a critical feedstock for biodiesel and renewable diesel production. The margin ADM earns from processing soybeans is therefore directly tied to the policy environment governing biofuel demand.
Throughout 2025, that policy environment was uncertain. The 2025 biofuel mandates had been set under the previous Biden administration. But renewable diesel producers had no visibility into what the 2026 and 2027 mandates would look like under the new Trump administration. These producers systematically make long-term supply decisions based on multi-year policy visibility. Without it, they could not commit to long-term soybean oil contracts.
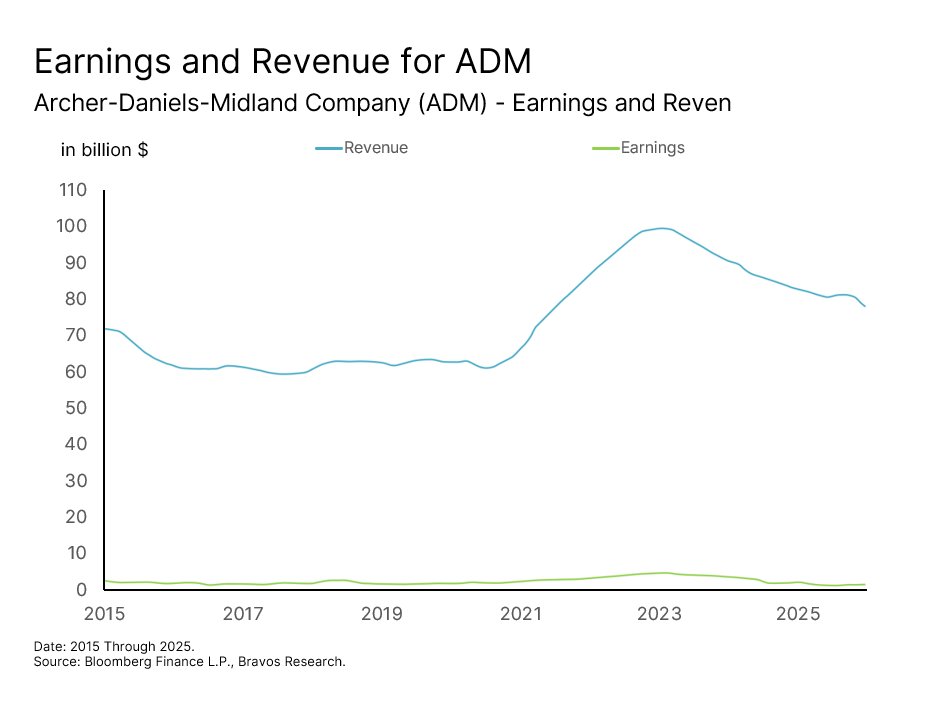
As the largest soybean crusher in North America, ADM bore the full weight of that gridlock. Over the past few years, revenues fell 20% and net margins compressed from 4.4% to 1.3%. The most damage naturally came from the soybean crushing business, where operating profit fell by 81% in 2025 alone.
That same policy uncertainty is now turning out to be the primary catalyst for the recovery. The Trump administration recently finalized the 2026 and 2027 biofuel mandates, which came in well above earlier proposals. Biodiesel and renewable diesel production is required to increase 60% from 2025 levels. This immediately restores the demand visibility that renewable diesel producers were missing.
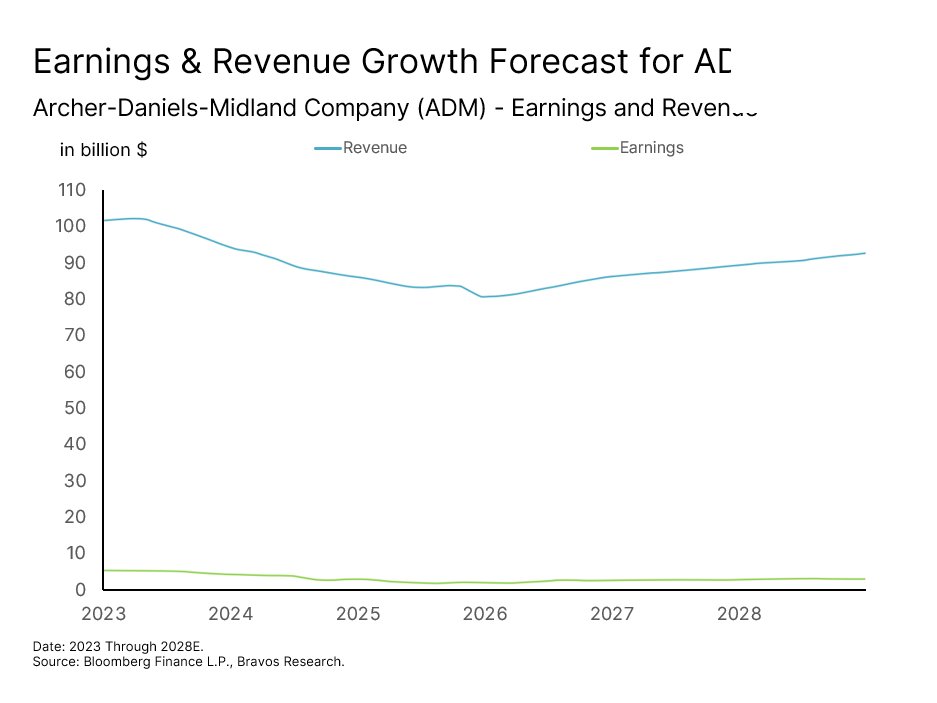
Such a shift now turns a multi-year financial headwind into a primary tailwind for ADM. As a result, the company's revenue and earnings are both projected to recover meaningfully over the next three years as soybean oil demand finds its footing and crush margins normalize.
ADM Used the Downturn to Build a Leaner Business What makes this recovery even more compelling is that ADM did not sit idle during the downturn. The company launched a cost savings program in 2025 targeting $500 to $750 million in aggregate savings over three to five years. Roughly $200 million of that has already been achieved through portfolio optimization and efficiency improvements. So as revenues recover, they are flowing into a leaner cost structure than existed before the downturn.
On top of this, the 45Z clean fuel production tax credit is expected to contribute an additional $100 million directly to the bottomline in 2026. This rewards ADM for the low-carbon intensity of its biofuel operations. The combination of recovering crush margins, a leaner cost base, and the 45Z tailwind creates a recovery story with multiple engines driving it at the same time.
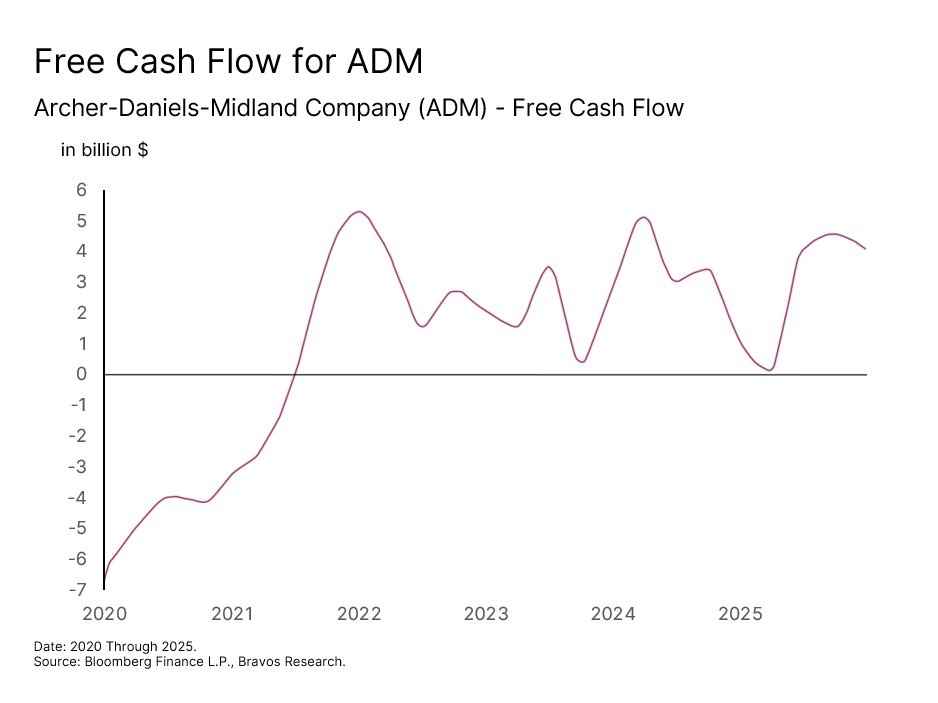
It’s also worth noting that when soybean crush profits fell 81%, the company still generated $4.2 billion in free cash flow and maintained a healthy cash position of over $1 billion. That speaks to the underlying resilience of a business that touches nearly every part of the global agricultural supply chain.
Dividends and Buybacks are Increasing Shareholder Value
As revenues and earnings now recover, ADM's free cash flow is likely to grow even further. What makes this particularly attractive for investors is what ADM does with that cash. The company has a 53-year streak of consecutive dividend increases. This track record has survived every major agricultural bear market and geopolitical shock of the past half-century.
Beyond dividends, ADM is also running a buyback program targeting the repurchase of 300 million shares by 2029. The company has already bought back 185 million of those shares, with 115 million remaining. That means another 24% of total shares outstanding is likely to be taken off the market within the next three years. This will directly increase the earnings per share for every shareholder who stays invested.
The Stock Still Remains Undervalued
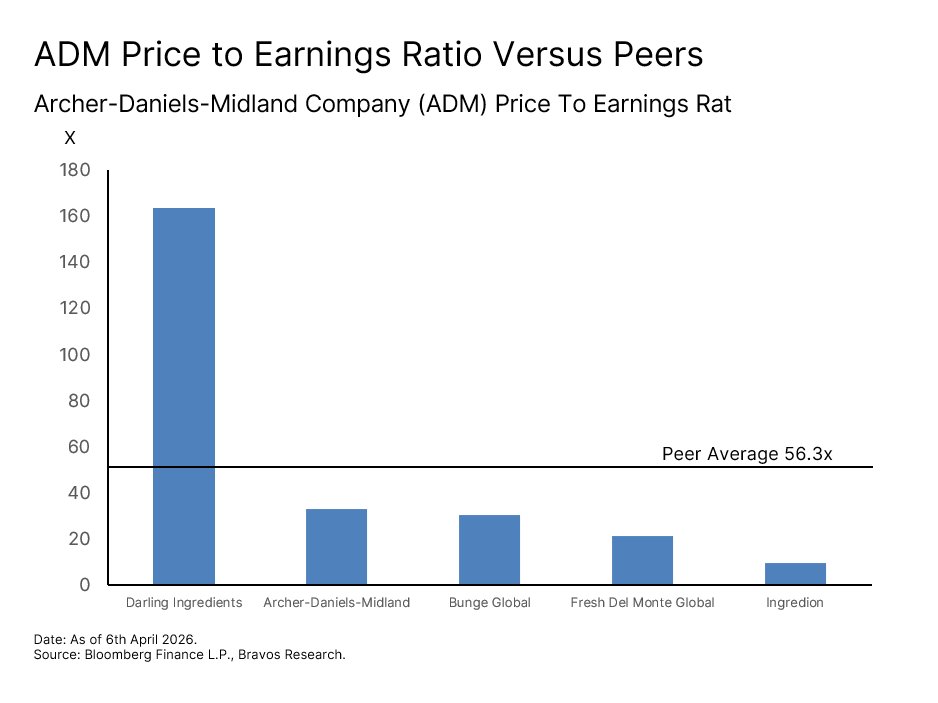
Despite all of this, the company currently trades at a PE ratio of 33x. That is undervalued when compared to its peer average of 56.3x. More importantly, the earnings that make up the current valuation are near their cyclical low.
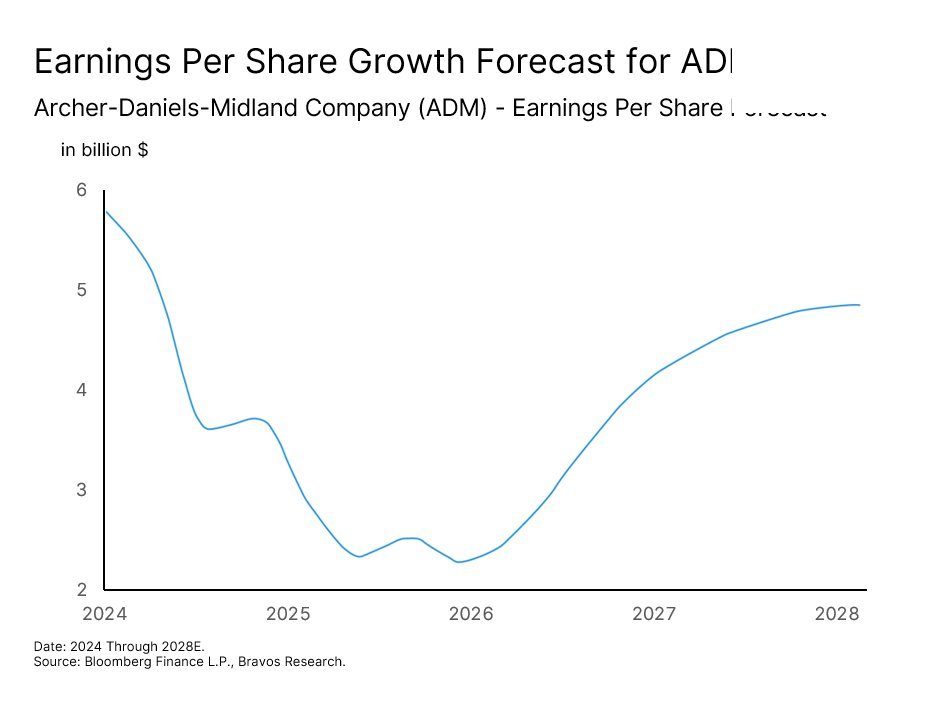
As crush margins normalize and the cost savings program delivers its full benefit, earnings per share should recover from $2.20 today toward $4.80 by 2027. These were levels ADM was already generating in 2024, meaning such a recovery does not require anything extraordinary from the company.
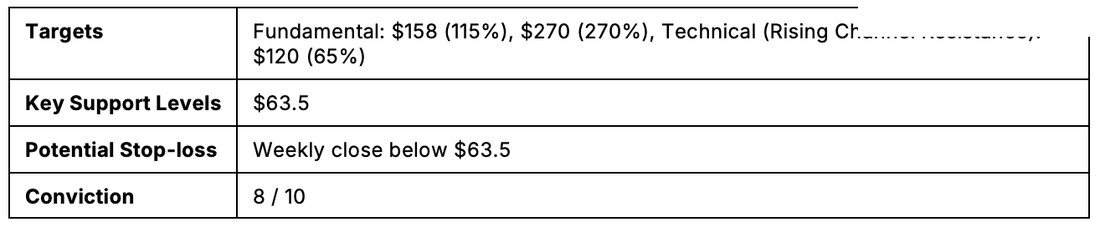
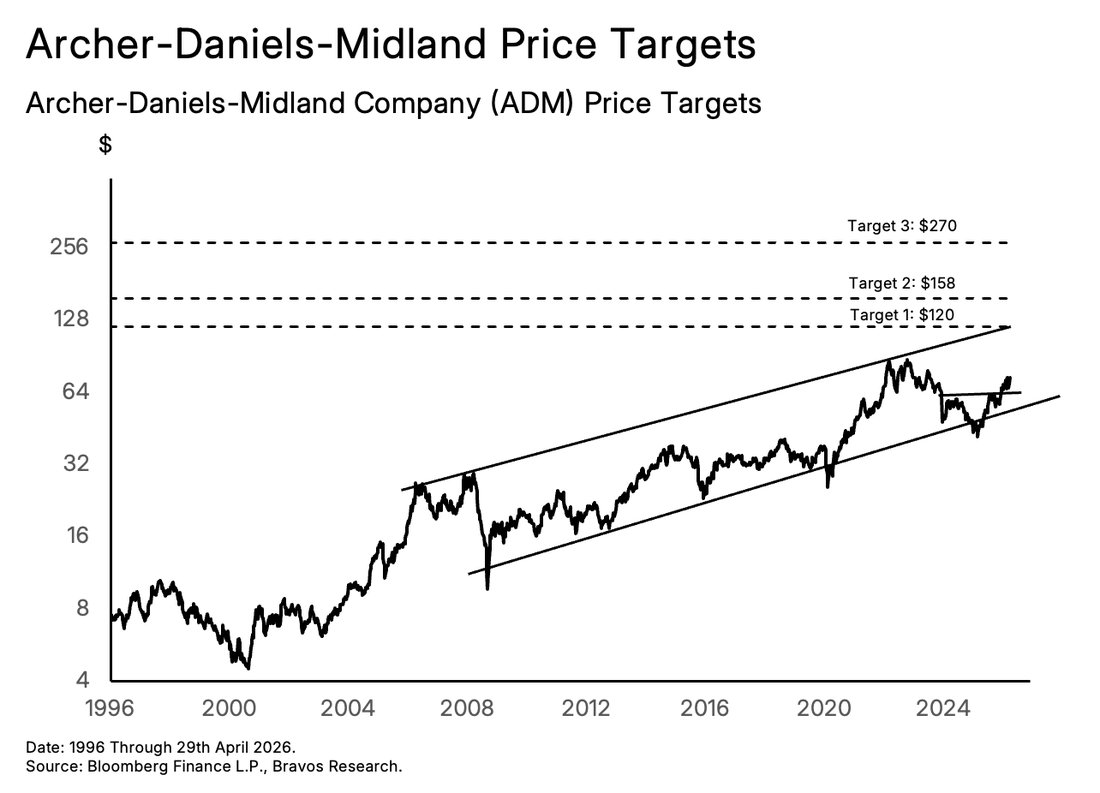
That earnings recovery alone, with no change in the current PE ratio, implies a share price of approximately $158. This represents around 115% upside from current levels. If the market also begins to re-rate ADM closer to the industry average PE of 56.3x as earnings recover, the implied share price rises to approximately $270. That would translate into 270% upside from where the stock currently trades.
ADM’s technical picture adds further confluence to the company’s recovery case. The stock recently broke out of an inverse head and shoulders basing pattern, one of the more reliable reversal signals in technical analysis. This breakout is also occurring within a rising channel that has been in place since 2006. The upper boundary of that channel points toward a medium-term price target of $120. That would be a 65% move up and sits comfortably within the range of the fundamental price targets highlighted above.
Our overall conviction on ADM is 8 out of 10. Our line in the sand is a weekly close below $63.5, which is the breakout level for the inverse head and shoulders base. If price closes back below that, it would suggest a false breakout. We have professional money managers helping our members capture trades on this stock during periods we view as most attractive.
Stock 4: Deere & Company (DE)
The three stocks we have covered so far in this report (Nutrien, The Andersons, and Archer-Daniels-Midland) all benefit directly from rising crop prices. Deere represents a fundamentally different type of bet in the list. Rather than benefiting from the price of what farmers grow, Deere benefits from the economics of how they grow it. And in an environment where fertilizer costs are surging, energy prices are rising, and labor is increasingly difficult to source, the value of growing crops more efficiently has never been higher.
This is the lens through which we think about Deere's precision agriculture stack. As we already know, fertilizers costs have risen sharply. When those costs rise, every tool a farmer has to reduce waste becomes financially critical. Deere's See and Spray technology does exactly that. This tech delivered an average 59% reduction in herbicide usage across five million acres in 2025. It did that by using cameras and AI to identify individual weeds and trigger spray nozzles only where needed. For a farmer facing rising input costs (like urea that’s up 50%) this becomes an essential margin protection tool.
Deere & Company (DE)
A precision-agriculture moat with multi-cycle compounding.
What makes this dynamic particularly powerful for Deere is the “lock-in” effect it creates. Once a farmer integrates Deere's systems into their operation, switching to a competitor means abandoning the entire decision-making layer that manages their most expensive inputs. Fertilizer, herbicide, and seeds make up the three largest variable costs in crop production. All three can be meaningfully reduced when the equipment knows exactly where to apply them. That kind of precision keeps customers loyal to the Deere ecosystem.
As a result of this business model, the company has also historically remained resilient when grain prices fall. For example, between the 2012 peak and the 2020 bottom, corn and soybean prices declined by 50 to 60%. That was a challenging environment for most agricultural companies. Yet, Deere's stock rose by over 100% during that same period. The reason for this is quite straightforward. Farmers don't stop farming when crop prices fall. Instead, they look for ways to do it more efficiently - precisely what Deere sells.
The Labor Shortage is Accelerating the Case for Autonomous Farming The labor dimension adds another layer to the long-term case. In key agricultural markets, sourcing reliable farm labor is becoming increasingly difficult at almost any
price. Deere's roadmap addresses this directly.
The company is targeting fully autonomous row-crop systems by 2030. This will allow machines to operate 24 hours a day without a driver, making real-time agronomic decisions in the field. The recent acquisition of Tenna, a fleet intelligence platform, accelerates this roadmap by giving Deere the ability to manage entire autonomous fleets. By integrating these capabilities, Deere is essentially transforming its business into a recurring, high-margin agricultural technology platform.
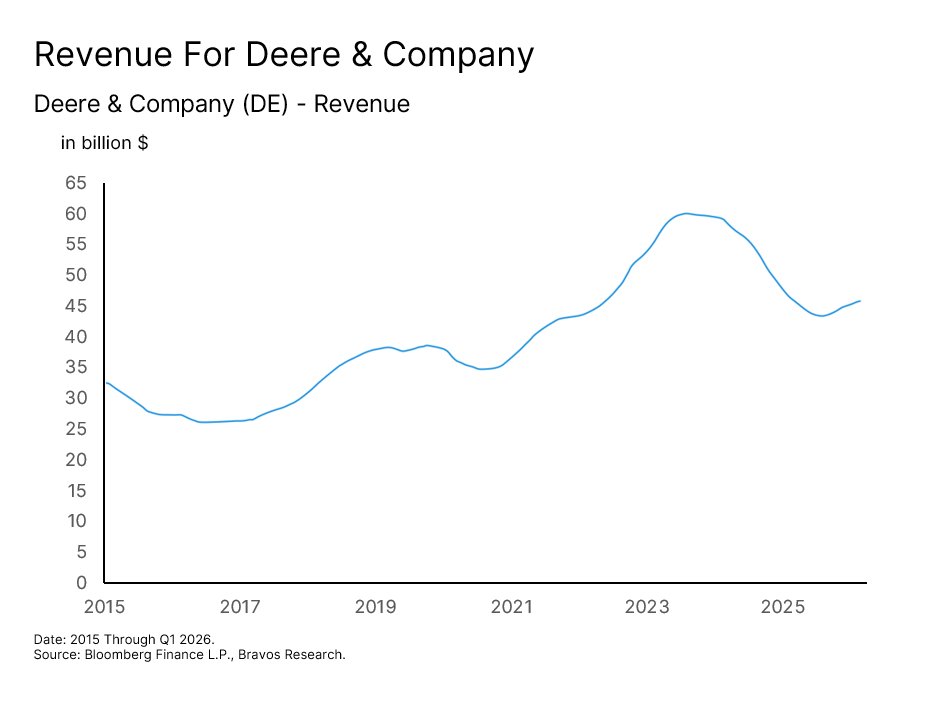
Deere's revenue had grown from around $37 billion in 2015 to a peak of approximately $61 billion in 2023. Since then, revenue has pulled as the agricultural equipment cycle cooled off. But with agricultural input costs now rising, Deere’s new technology offerings are becoming increasingly important. This lays the foundation for the next step up in revenue, with the potential to surpass the 2023 highs.
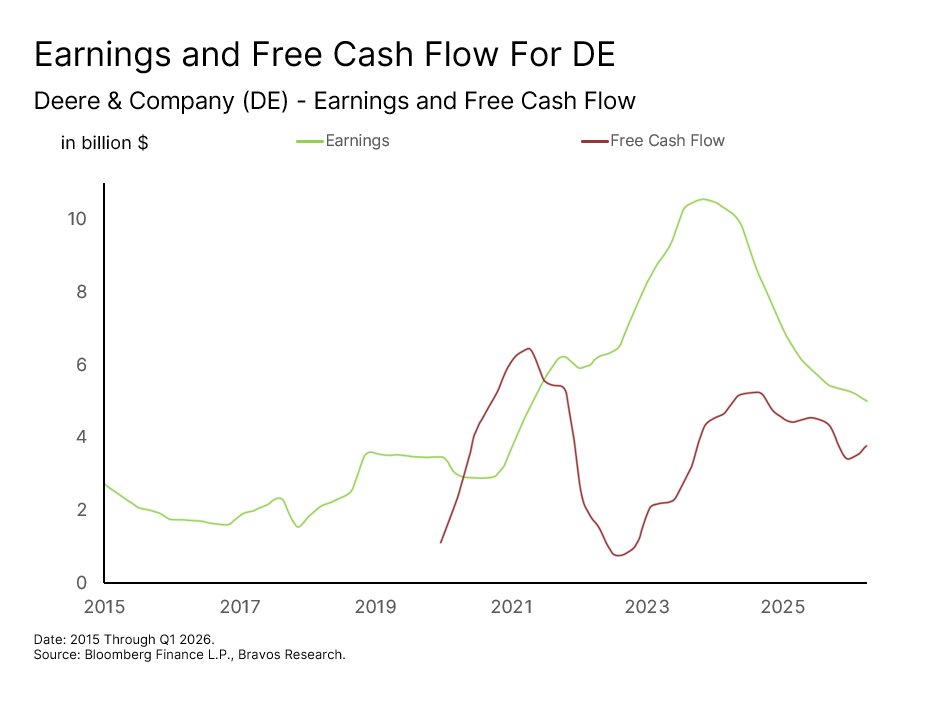
More importantly, despite the pullback in revenue and earnings, the company’s free cash flow has consistently remained positive. That is not typical of a cyclical equipment manufacturer. It actually reflects the growing contribution of software, services, and
recurring technology revenue that does not necessarily move in sync with equipment sales. A business that generates this level of free cash flow at the lower end of its cycle has the potential to see it rise significantly as revenue and earnings pick back up.
Deere Outperforms the Broader Sector in Both Up and Down Markets
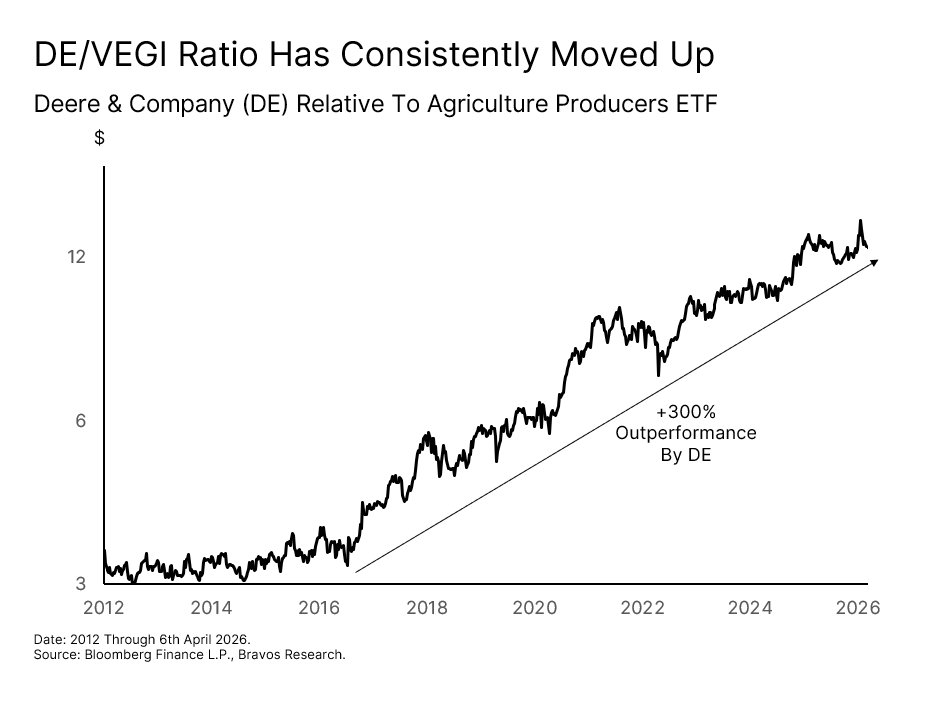
Deere’s structural outperformance relative to the VEGI ETF has been a direct consequence of the company’s business model. Since 2016, Deere has outperformed VEGI by over 300%. In other words, Deere has not only been a relatively more attractive investment when crop prices are rising, but also during agricultural downturns. So the market has typically treated Deere like a "flight to quality" type of asset for the entire sector. However, we don’t think the stock reflects that premium positioning yet.
The Stock Has Not Yet Reflected Its Earnings Power
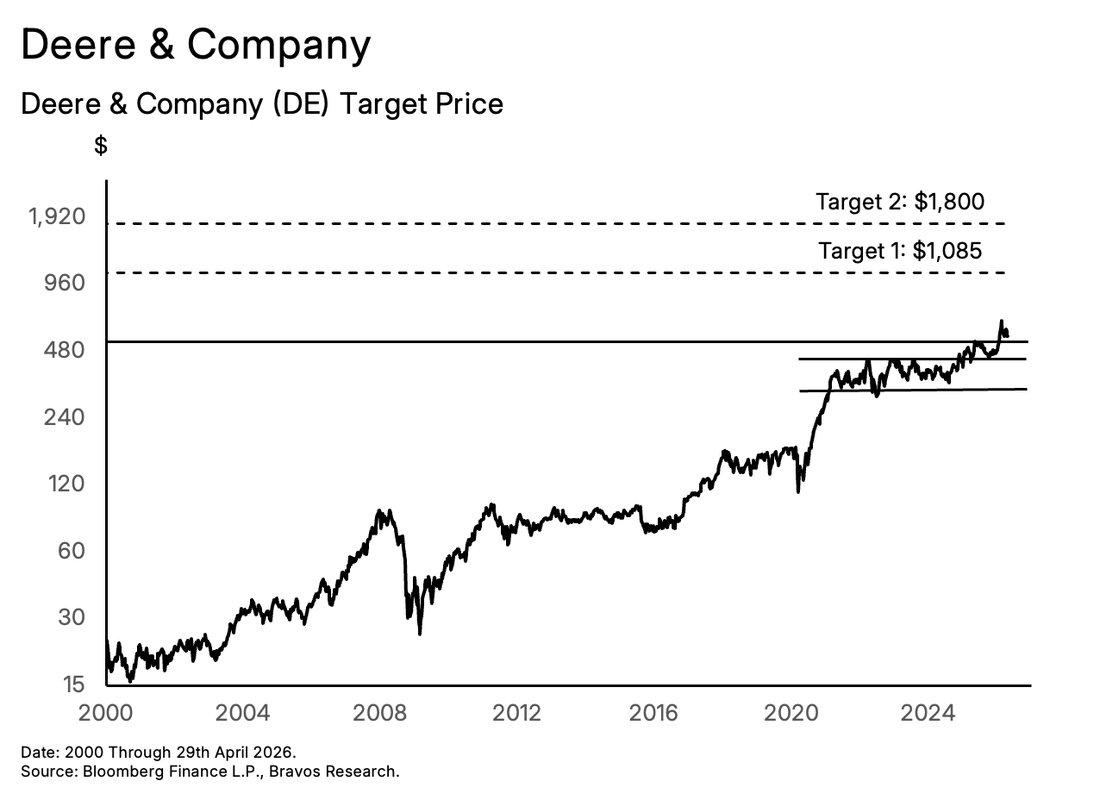
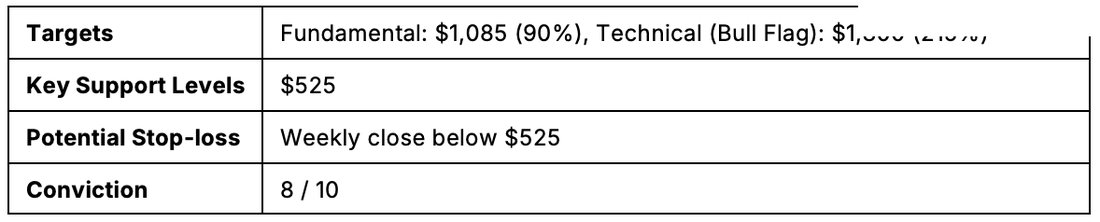
Deere's earnings per share currently sit at approximately $17.80. At its earnings peak in 2024, that figure was nearly double at $33.50. We think this level of earnings power is a realistic baseline to return to. This would be driven by higher crop prices and technology adoption that’s becoming essential for farmers in this high cost environment. Moreover, It does not require anything the company has not already demonstrated it can deliver. Applying the current PE of 32.3x to that earnings power implies a share price of approximately $1,085. That represents around 90% upside from current levels.

The technical picture adds further conviction to this case. The stock recently broke out of a bull flag pattern. This is a technical formation where a sharp move higher is followed by a period of consolidation before the uptrend resumes. The implied long-term target from this pattern is approximately $1,800, representing around 215% upside.
For that target to be reached, however, the company will require strong execution on three fronts:
1) Strong adoption of the precision agriculture and automation technology stack 2) Sustained recovery in large agriculture equipment demand 3) Successful execution on the autonomous systems roadmap by 2030
Our conviction level on Deere is 8 out of 10. To manage risk, our invalidation is a weekly close below the $525 support level. A decisive close below that would cause us to reassess the technical setup.
Willi-Food (WILC)
Highly cash-generative kosher food consolidator.
Stock 5: G. Willi-Food International Ltd. (WILC)
Similar to Deere, G. Willi-Food International also represents a very different type of bet from the commodity-linked plays we have covered earlier in this report. Most of the earlier names covered are direct expressions of the agricultural commodity upcycle. Whereas, Willi-Food operates at a cultural and regulatory bottleneck in the global food system — the kosher food market.
Today, 41% of all new packaged food and beverage demand in the US falls under the kosher category. This makes it the single most important food label in the country, ahead of even gluten-free and allergy claims. To sell kosher products, a company must work with certification bodies that conduct on-site supervision, maintain ongoing oversight of ingredients and production processes, and re-certify regularly. These relationships take years to establish without any short cuts. A high level of oversight is what makes the space genuinely difficult to enter and protects established players like Willi-Food.
This is particularly valuable in today's environment because kosher consumers cannot just simply buy a non-kosher product as a cheaper substitute. The certification itself makes up a key part of the product. So on one hand, rising input costs are squeezing margins for generic food producers across the board. But Willi-Food's demand is largely insulated from those pressures because its customers are not “cost-sensitive” but “certification-sensitive”.
Record Revenue and Earnings Despite a Weak Agricultural Market
The demand insulation has been clearly showing up in the company's financial trajectory. WILC’s revenue hit a record $191 million in 2025, growing by 6% from 2024. Its operating profit grew by 35.6% on that same 6% revenue growth. Simply put, the company has been able to extract an increasingly larger amount of profit from every dollar of revenue it’s generated. As a result, earnings have grown by 28.6% to a record $28.4 million. All of this came despite broader agricultural market weakness during the same period. And based on the company’s recent expansions, we think this growth trajectory is likely to continue.
Expansion Into Higher-Margin Categories Without Stressing the Balance Sheet
Willi-Food has invested $35 million into building infrastructure for a new refrigerated and
frozen logistics center. All of this is funded entirely from the company's cash reserves and will come online in Q4 2026. This facility opens up the chilled and frozen categories for Willi-Food, where it faces no meaningful certified competition. These segments also carry higher selling prices and margins than the dry kosher products that historically defined the business.
The timing of this infrastructure rollout also coincides with the scaling of the Euro brand, WILC's proprietary dairy subsidiary. In a high cost environment, the Euro brand offers a high-quality, cost-effective alternative to domestic dairy monopolies. The new logistics center being built out will enable volume distribution for Euro’s frozen products. This is turning Willi-Food from a pure distributor into a branded producer with its own proprietary distribution network. Owning both the product and the distribution means the company captures margin at two points in the value chain thus increasing its earnings potential.
The second expansion is via the HORECA division launched last year. This is a dedicated professional foodservice channel aimed at directly serving hotels, restaurants, and cafes. These buyers place significantly larger orders, require less promotional spending, and prioritize supply reliability and certification credentials over price. The HORECA division alone is on track to add 12% to total revenue.
Now even after funding all of these expansions internally, Willi-Food still holds approximately $122 million in cash with zero debt. For a $350 million market cap company, that is an exceptionally strong financial position. In simple terms, almost 35 cents of every dollar invested in this stock is already backed by cash sitting on the balance sheet. This significantly strengthens the company’s ability to continue its aggressive expansions to further grow its revenue and earnings.
The Market Has Not Yet Recognized What This Business is Becoming
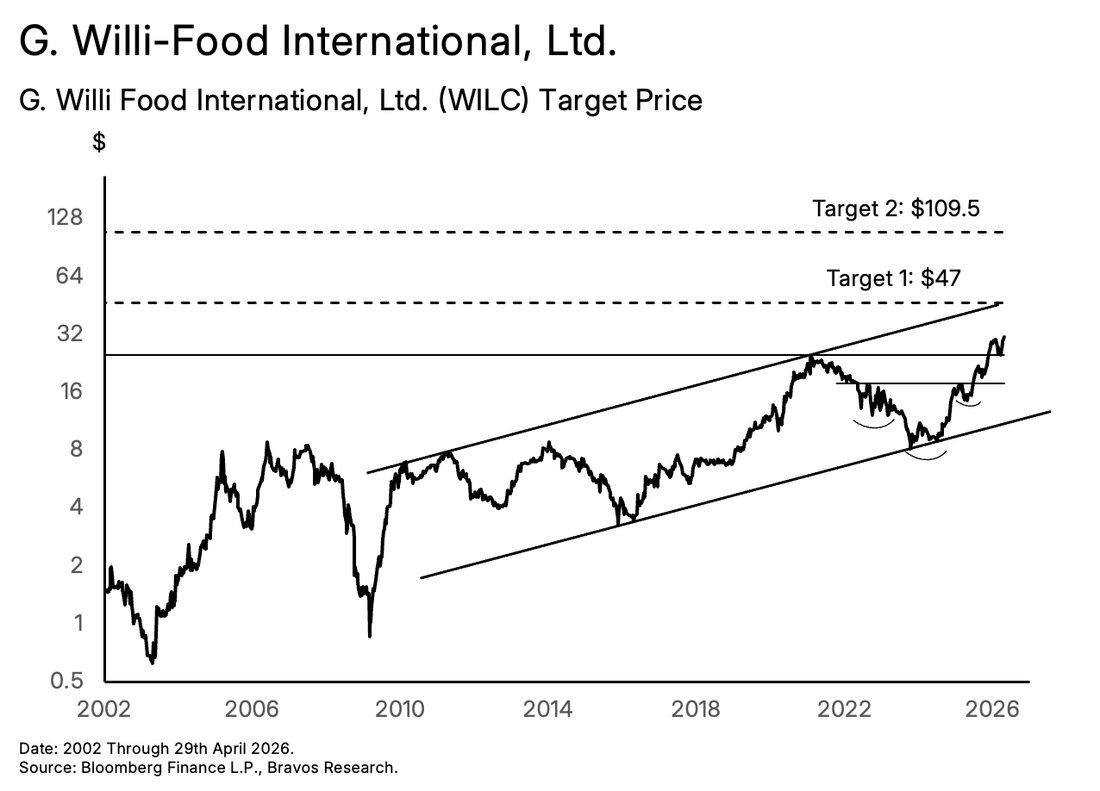
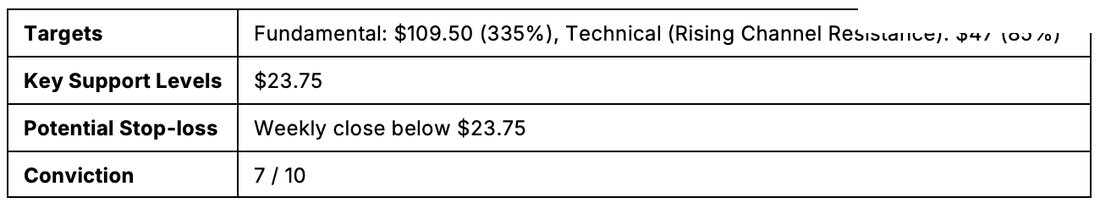
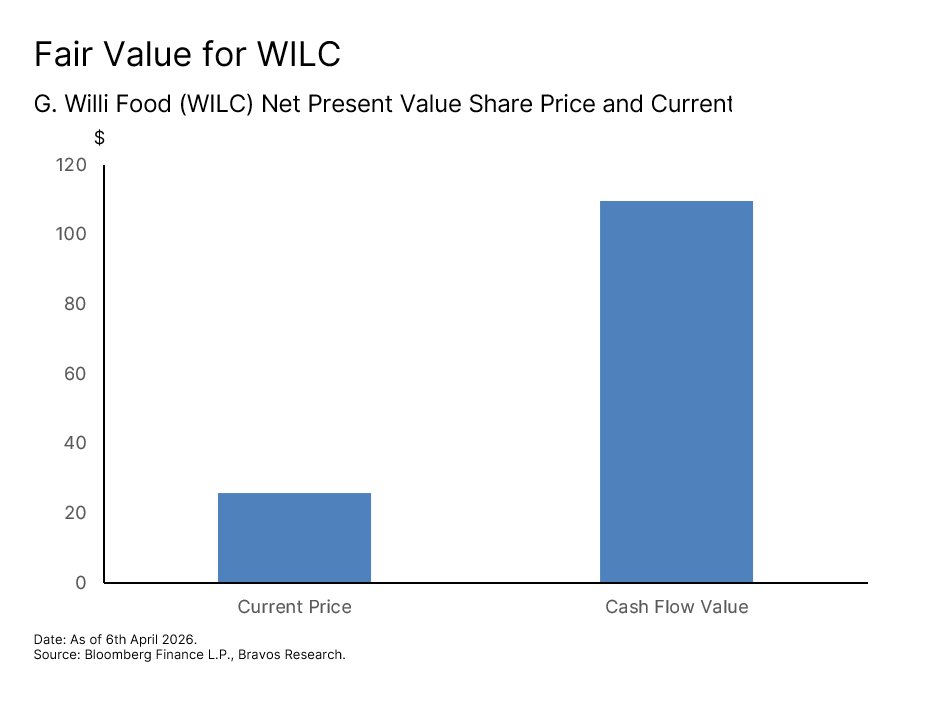
Despite all of this, the stock still trades at a PE of just 12.2x. This is less than half its peer average of 26.5x. One way to assess what WILC’s business is actually worth is to look at the present value of its projected future cash flows. This approach takes the earnings the company is expected to generate over the coming years and calculates what those earnings are worth in today's dollars. Using this approach, the fair value comes out to $109.50 per share. This represents the potential for 335% upside from current levels for investors willing to hold as the market recognizes the full value of what is being built here.

WILC’s stock has also been showing significant strength. It broke out of an inverse head and shoulders basing pattern last year and has hit all-time highs in 2026. This move is occurring within a rising channel that has been intact since 2011. The upper boundary of this channel provides a medium-term target of $47. That would be a 85% move up and is well within the range of its fair value target highlighted above.
Our conviction on this name is 7 out of 10. That’s because unlike the other names that are more diversified, Willi-Food is a slightly more niche investment. However, with the kosher category increasingly growing in the US, we think there’s still the potential for significant upside here. Our risk management strategy is to monitor the $23.75 support level. A weekly close below it would make us re-assess this setup.
CF Industries (CF)
Lowest-cost nitrogen producer in a tightening market.
Stock 6: CF Industries (CF) Every crop in the world requires nitrogen to grow. And the only commercial way to produce nitrogen fertilizer at scale is through ammonia. CF Industries is the world's largest ammonia producer. What makes CF particularly compelling is not just its size though, but what it costs to produce ammonia.
Natural gas is the primary input for ammonia production and CF's North American facilities source it at approximately $3.36 per MMBtu. European and Asian competitors, on the other hand, are paying $10 to $15 per MMBtu. As we highlighted earlier, gas fields in Iran and Qatar have been severely damaged in the war. These are among the world's largest natural gas reserves, which are unlikely to return to pre-war levels anytime soon. CF’s European and Asian competitors relied on this supply heavily for their ammonia production. So they are now being forced to reduce production and in some cases even shut down. As a result, North American supply is becoming increasingly critical to the global nitrogen market with CF sitting right at the center of it.
Global nitrogen prices are largely set by the cost of the highest-cost producer, which are the European and Asian competitors using expensive gas. CF produces it at a fraction of the cost but sells at the same global price. The wider that gap, the more profit CF captures on
every tonne sold. As we already established earlier, fertilizer demand around the planting window is highly inelastic. Farmers cannot defer nitrogen application even when prices are high. That inelasticity means CF can hold its prices without losing volume. This is why the company’s stock tends to move closely with nitrogen-based fertilizer prices like urea. And we saw exactly how profitable this can be for the company during the last agricultural bull run.
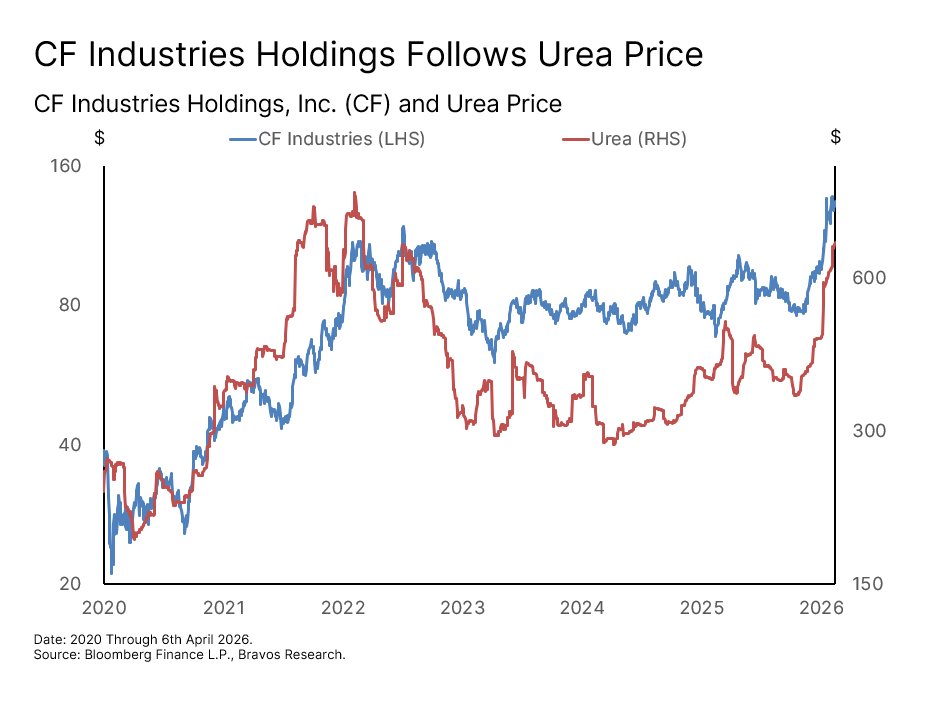
Between 2020 and 2022, CF's revenue tripled from $4 billion to nearly $12 billion, with profit margins reaching nearly 30%. This led to a ten-fold increase in the company's earnings from $320 million to $3.2 billion in just 2 years. The reason for this is pretty straightforward. CF's production facilities cost roughly the same to run regardless of where nitrogen prices are. So when prices rise, almost all of the incremental revenue flows directly to the bottom line. This cycle seems to be beginning again as fertilizer prices have been rising. The company’s revenue has already grown by 23% in the past year, with its profit margin currently at 20.5%. But this time there’s another catalyst building that could eventually propel CF’s revenue and earnings even higher than before.
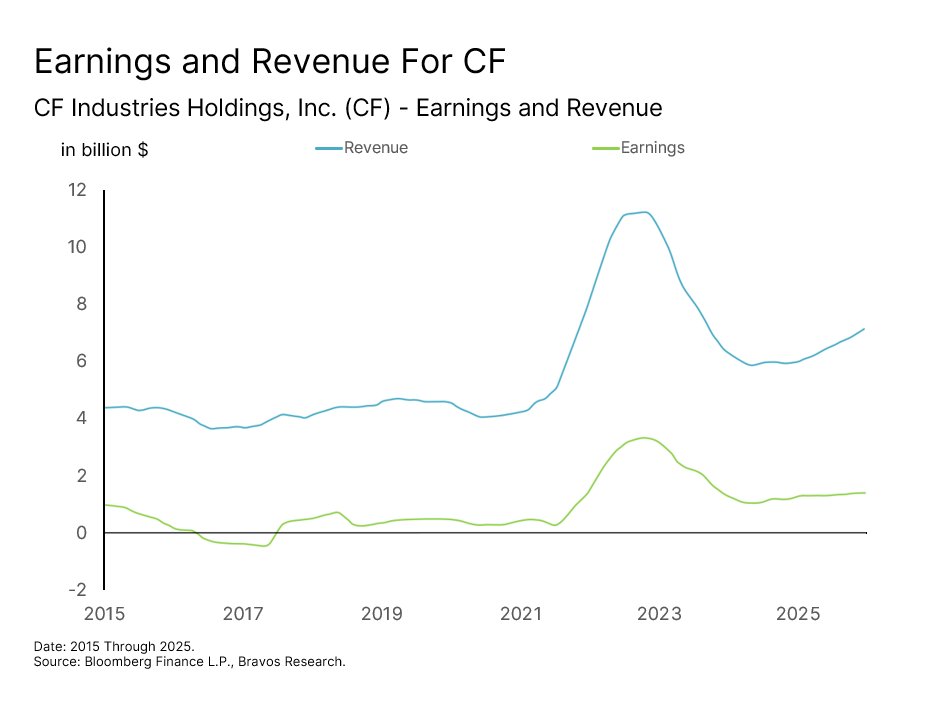
A Second Earnings Stream is Being Built in Parallel
CF has been expanding into low-carbon ammonia production, which qualifies for government incentive programs in the US and Japan. Through its Blue Point joint venture in Louisiana, the company is building a $4 billion facility to supply clean-burning ammonia to markets in Japan, Europe, and the US. This venture was formed with JERA, Japan's largest energy company, and Mitsui, one of Japan's largest trading houses. Construction for it begins this year with production expected in 2029. What makes this particularly attractive is that a portion of the revenue is already secured before the facility even opens. CF's Japanese partners have locked in government-backed agreements at a fixed price for the ammonia produced.
Moreover, the demand backdrop for this investment has been growing stronger. Japan, South Korea, and the European Union have all passed laws requiring their shipping, power, and industrial sectors to move away from fossil fuels over the coming decade. Ammonia is one of the primary alternatives they are turning to. CF’s Donaldsonville facility is already selling certified low-carbon ammonia to customers in Europe at a premium to conventional prices. Its Blue Point project is being built on this same model, but at an industrial scale.
Buybacks are Amplifying Every Dollar of Earnings Growth
As revenues grow and margins expand, CF generates significant free cash flow. For example, between 2020 and 2022, free cash flow rose from $900 million to $4.3 billion. What makes this particularly attractive for us is the buybacks that the company does with this cash. Last year alone, CF retired approximately 10% of its total shares outstanding. Management has also authorized a new $2 billion program through 2029. The combination of the company’s buyback strategy and dividend payouts together deliver a total shareholder yield of 8.8%.
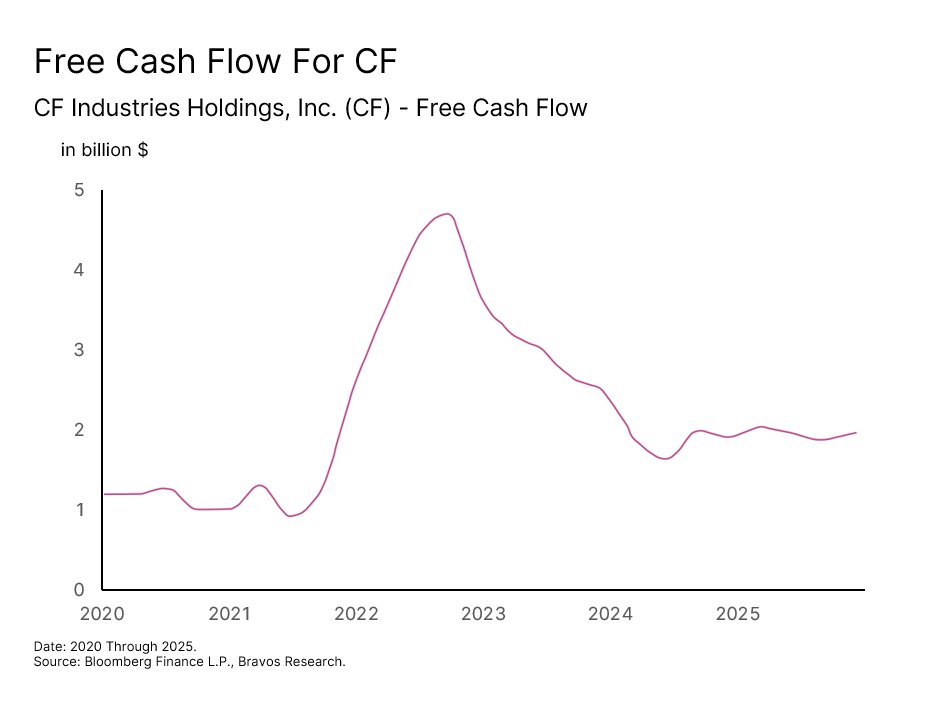
This is why CF has been one of the biggest outperformers within the broader agricultural sector. The CF/VEGI ratio recently reached new highs after a 50% outperformance by CF since the start of 2026 alone. In a rising agricultural commodity environment, owning sector leaders is a strategy we like to use to maximize our potential returns.
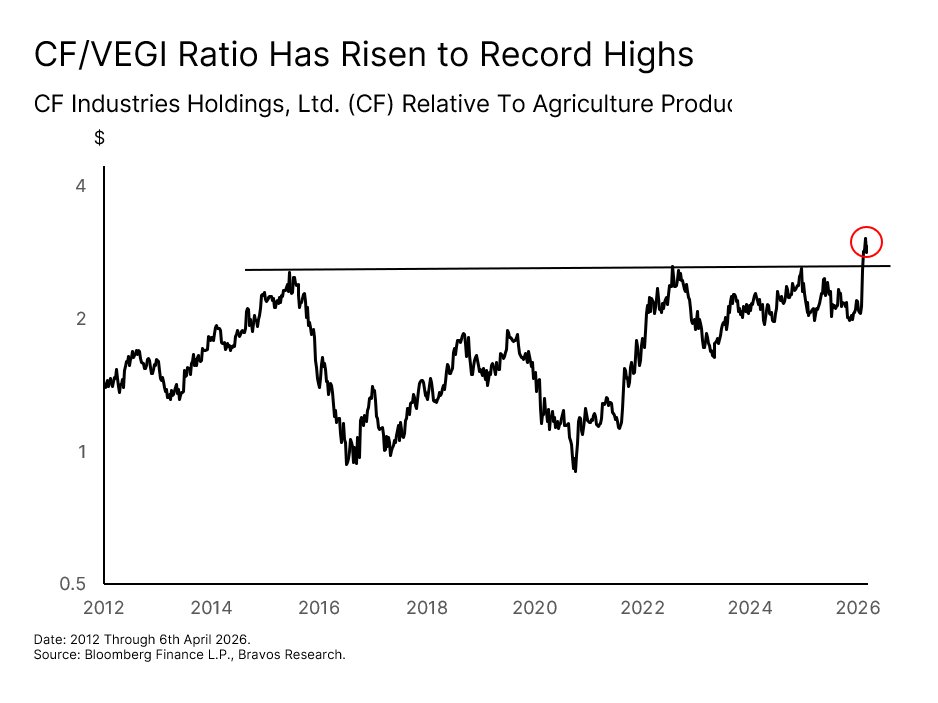
The Stock Has Yet to Reflect the Full Extent of the Opportunity
Despite all of this, the stock currently trades at a PE of just 14.1x. That is less than half the peer average of 29x. But more importantly, it’s significantly lower than the 40.2x level the company had reached during the 2020 to 2022 agricultural commodity bull market. A recovery in CF’s revenues toward the 2022 peak levels while simply maintaining its current 20.5% margins, would translate into an earnings per share of approximately $16.75. This is a level the business has already delivered before in 2022, and that was without the low-carbon ammonia division existing back then.
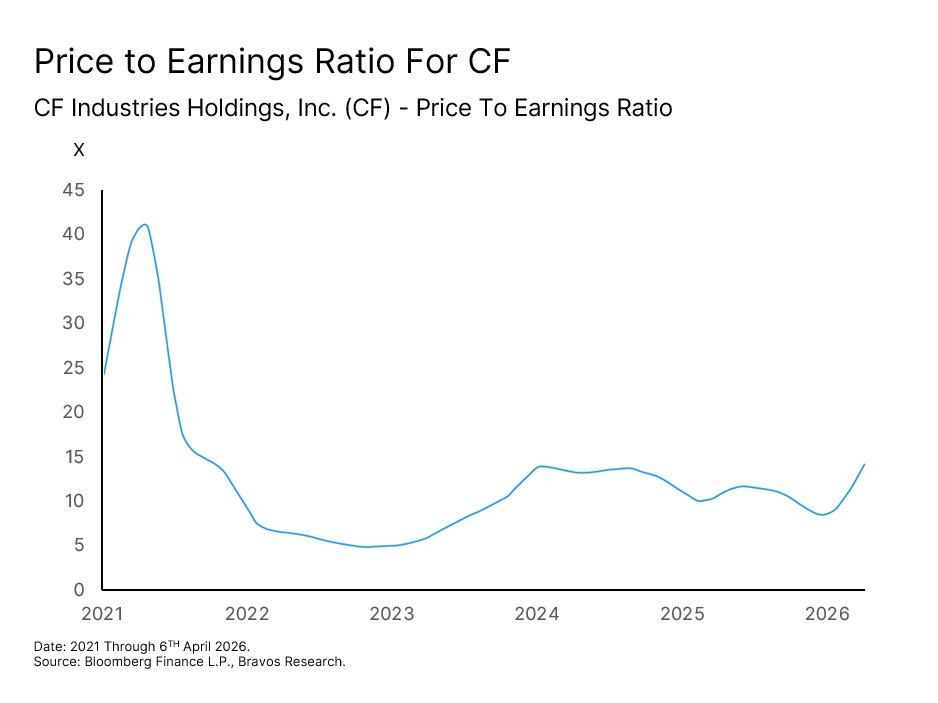
If the market begins to price in that earnings recovery and re-rates CF simply back to its peer average of 29x, the implied share price rises to approximately $486. That represents around 285% upside from current levels. And if CF were to revisit the 40.2x PE it saw during the 2021 commodity bull run as confidence in the cycle grows, the implied share price rises further to approximately $674. This would represent a 435% upside potential.

In the medium term, the technical picture is governed by a rising channel that has been in play since 2018. The upper boundary of this channel sits at $260, representing a 95% gain. We expect the stock to gravitate toward this level as nitrogen pricing momentum builds and the Blue Point construction timeline comes into focus. Our overall conviction on this stock is 9 out of 10.
Tactically however, CF is currently overextended and likely due for a consolidation. A key support level that we’re watching is $112.5. Our stop-loss for this would be a weekly close below the $100 level to protect ourselves against a deeper correction.
Final Thoughts
Closing summary on the thesis and execution.
The macro environment and sector research both point in the same general direction: Agricultural commodities are significantly undervalued today. And the conditions required to change that are already taking place.
The agricultural supply chain has been severely disrupted at the worst possible moment. Demand is structurally growing faster than the land and resources available to meet it. The institutional money that was betting against all of this has only just started to reverse. We believe the bulk of the move in this space is still ahead of us.
The six stocks in this report each represent a distinct way to express this thesis. Together, they offer exposure to different parts in the agricultural chain, from fertilizer producers to infrastructure owners to technology platforms. Each one offers a different risk-reward profile that we believe are among the most attractive in today's environment.
We have high conviction in the research and stocks outlined in this report. But conviction alone does not deliver returns. How these positions are managed through what will inevitably be a volatile period will matter just as much as the thesis itself.
Managing the position is going to matter as much as the call itself. Sizing, stop placement, and how aggressively to add on confirmation are all going to determine whether this thesis turns into a meaningful return or just an idea that aged well on paper. The volatility around the oil shock and the geopolitical overhang means there will be drawdowns even if the structural thesis plays out exactly as laid out here. Plan the position before entering it.